. 2016 Nov 10;12(11):e1005976.
doi: 10.1371/journal.ppat.1005976. eCollection 2016 Nov.

Evolution of Fitness Cost-Neutral Mutant PfCRT Conferring P. falciparum 4-Aminoquinoline Drug Resistance Is Accompanied by Altered Parasite Metabolism and Digestive Vacuole Physiology

Affiliations

Evolution of Fitness Cost-Neutral Mutant PfCRT Conferring P. falciparum 4-Aminoquinoline Drug Resistance Is Accompanied by Altered Parasite Metabolism and Digestive Vacuole Physiology

Stanislaw J Gabryszewski et al. PLoS Pathog. .

Abstract

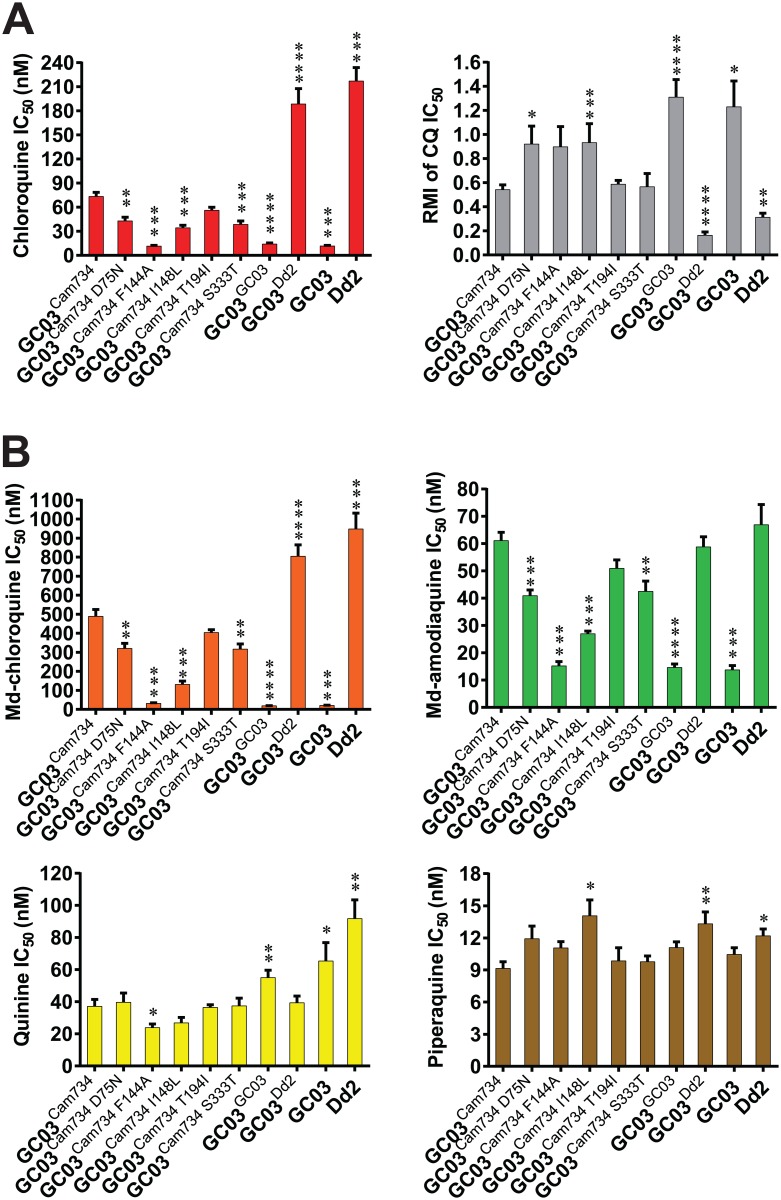
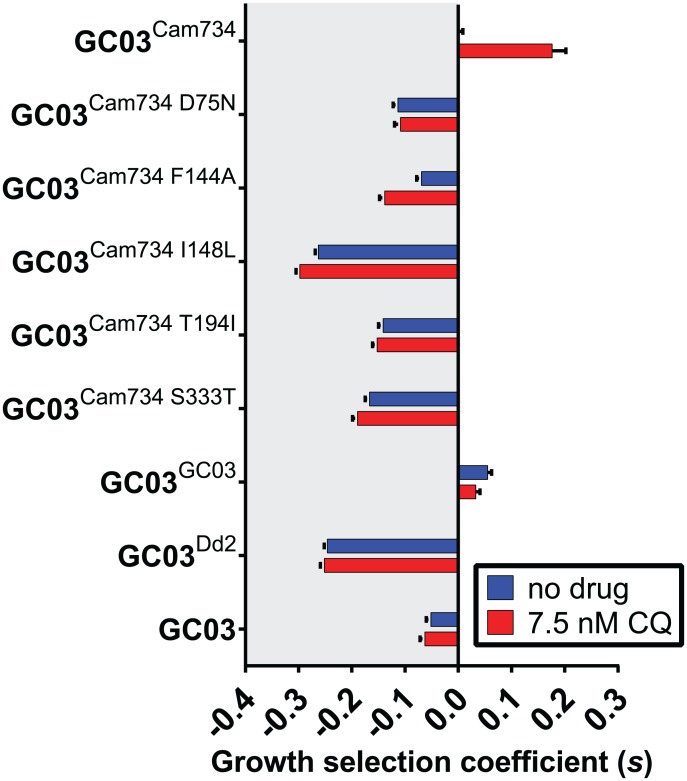
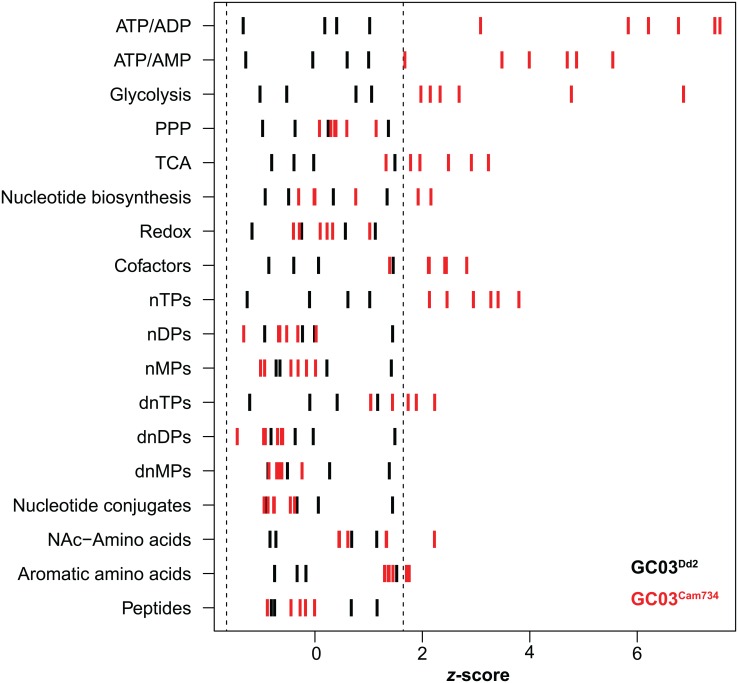
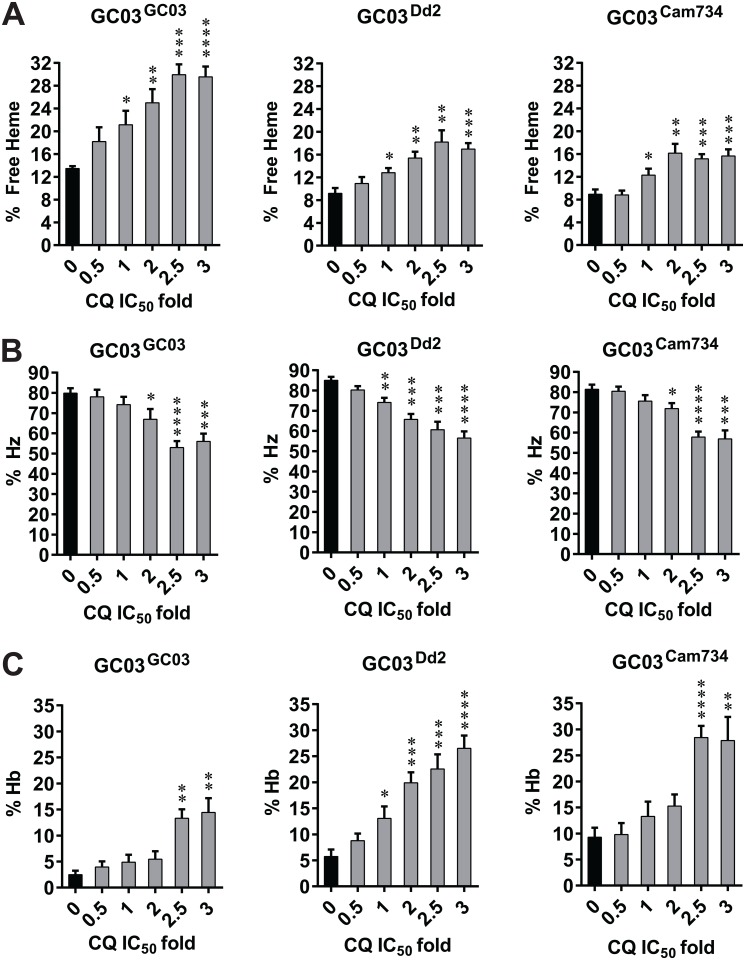
Southeast Asia is an epicenter of multidrug-resistant Plasmodium falciparum strains. Selective pressures on the subcontinent have recurrently produced several allelic variants of parasite drug resistance genes, including the P. falciparum chloroquine resistance transporter (pfcrt). Despite significant reductions in the deployment of the 4-aminoquinoline drug chloroquine (CQ), which selected for the mutant pfcrt alleles that halted CQ efficacy decades ago, the parasite pfcrt locus is continuously evolving. This is highlighted by the presence of a highly mutated allele, Cam734 pfcrt, which has acquired the singular ability to confer parasite CQ resistance without an associated fitness cost. Here, we used pfcrt-specific zinc-finger nucleases to genetically dissect this allele in the pathogenic setting of asexual blood-stage infection. Comparative analysis of drug resistance and growth profiles of recombinant parasites that express Cam734 or variants thereof, Dd2 (the most common Southeast Asian variant), or wild-type pfcrt, revealed previously unknown roles for PfCRT mutations in modulating parasite susceptibility to multiple antimalarial agents. These results were generated in the GC03 strain, used in multiple earlier pfcrt studies, and might differ in natural isolates harboring this allele. Results presented herein show that Cam734-mediated CQ resistance is dependent on the rare A144F mutation that has not been observed beyond Southeast Asia, and reveal distinct impacts of this and other Cam734-specific mutations on CQ resistance and parasite growth rates. Biochemical assays revealed a broad impact of mutant PfCRT isoforms on parasite metabolism, including nucleoside triphosphate levels, hemoglobin catabolism and disposition of heme, as well as digestive vacuole volume and pH. Results from our study provide new insights into the complex molecular basis and physiological impact of PfCRT-mediated antimalarial drug resistance, and inform ongoing efforts to characterize novel pfcrt alleles that can undermine the efficacy of first-line antimalarial drug regimens.


Conflict of interest statement

The authors have declared that no competing interests exist.

Figures

Fig 1
Fig 1. Drug resistance profiles of pfcrt-modified and reference parasite lines.
(A) Parasite chloroquine (CQ) responses and verapamil (VP) reversibility of CQ resistance. Briefly, flow cytometry was used to assess parasitemias and quantify the corresponding drug concentration-dependent inhibition following 72 h exposure to the indicated antimalarial drugs. Bar graphs correspond to mean ± SEM IC50 or response modification index (RMI) values. IC50 values correspond to the drug concentrations that produced 50% inhibition of parasite growth. The RMI of CQ IC50 is equivalent to (IC50 for CQ + VP) ÷ (IC50 for CQ only), as detailed in Materials and Methods. (B) Parasite responses to monodesethyl (md)-chloroquine, md-amodiaquine, quinine, and piperaquine. Bar graphs indicate mean ± SEM IC50 values. Results encompass 3 to 12 independent assays conducted in duplicate. Statistical differences were determined via non-parametric Mann-Whitney U tests, using the mean IC50 value of Cam734 pfcrt-expressing GC03Cam734 parasites as the comparator. CQ susceptibility and CQ RMI data are summarized along with corresponding statistical tests in S2 and S3 Tables, respectively. IC90 values and Hill slopes are also presented in S2 Table. *P<0.05; **P<0.01; ***P<0.001. ****P<0.0001.
Fig 2
Fig 2. In vitro growth profiles of pfcrt-modified and reference parasite lines.
Briefly, co-cultures initially consisting of a 1:1 ratio of a GFP test line and a GFP+ reporter line were monitored by flow cytometry each 48 h generation for 10 generations (see Materials and Methods and S3 Fig), and the per-generation selection coefficient (s) for each test line was derived from parasite growth curves (see Supplementary Materials and Methods). Bar graphs correspond to mean ± SEM s values for parasites subjected to no drug or 7.5 nM chloroquine (CQ). A summary of s values and inter- and intra-strain statistical tests is provided in S4 Table.
Fig 3
Fig 3. Metabolomic profiles of isogenic, mutant pfcrt-expressing parasites.
Metabolite extracts derived from tightly synchronized trophozoite-stage isogenic (GC03) parasites encoding either Dd2 or Cam734 pfcrt were analyzed by mass spectrometry. For each metabolite class, individual metabolite signals were expressed as z-scores (detailed in Materials and Methods), allowing for direct comparisons across distinct metabolite classes. Dashed lines represent lower (5%) and upper (95%) boundaries for the normal distribution, as defined for GC03Dd2 (black) parasites. Metabolites were harvested on three independent occasions (n = 4 to 6 total replicates per parasite strain). Compound class abbreviations, z-scores, and P values are presented in S6 Table.
Fig 4
Fig 4. Distribution of heme species in control and chloroquine (CQ)-treated pfcrt-modified parasite lines.
The percent of total heme present as (A) free heme, (B) hemozoin (Hz), or (C) hemoglobin (Hb) was measured spectrophotometrically in recombinant isogenic GC03 parasites expressing the wild-type (CQ-sensitive) GC03 pfcrt allele or mutant (CQ-resistant) Dd2 or Cam734 pfcrt alleles. Prior to heme fractionation, synchronous parasites were exposed for 32 h to multiples of strain-specific CQ IC50 values (1× IC50 values for GC03GC03, GC03Dd2, and GC03Cam734 in these experiments were 19.5 nM, 187 nM, and 90.9 nM, respectively). Bar graphs indicate mean ± SEM percentage values for 5 to 10 independent replicates. For each parasite line, values obtained for CQ-treated samples (gray bars) were compared against the untreated control (black bars), and statistical significance was determined via unpaired t tests with Welch’s correction. Absolute amounts of heme species as a function of CQ concentrations are depicted in S5 Fig. *P<0.05; **P<0.01; ***P<0.001. ****P<0.0001.
Fig 5
Fig 5. Parasite growth and percentage of free heme as a function of CQ concentration for recombinant isogenic pfcrt-modified parasites.
Curves show parasite growth (black curve) and percentage of free heme species (gray curve), graphed as a function of the log10-transformed CQ concentration (in nM). Plotted points and error bars correspond to mean ± SEM measurements made in parasite growth assays (n = 8–10) or heme fractionation assays (n = 5–10), as detailed in Materials and Methods.
Fig 6
Fig 6. Effect of Δψ on CQ-induced growth inhibition of yeast expressing PfCRT isoforms.
Growth (measured as OD600) of yeast harboring no (empty vector; solid black line), wild-type (GC03; gray line), Cam734 (blue line), Cam734 F144A (red line) or Dd2 (dashed black line). Growth was assessed in the presence of 5 mM CQ in conditions of low Δψ (left panel; pHexternal 7.20) or high Δψ (right panel; pHexternal 7.45), as detailed in Materials and Methods. Increased growth inhibition correlates with increased CQ accumulation in the yeast cytosol and reflects increased CQR [75]. Δψ increases with increased pHexternal due to compensatory mechanisms that maintain the electrochemical gradient across the cell membrane. Growth of yeast lines over the pHexternal range of 7.20–7.45 is surveyed in S6A Fig.

References

    1. White NJ, Pukrittayakamee S, Hien TT, Faiz MA, Mokuolu OA, et al. Malaria. Lancet. 2014; 383(9918):723–35. 10.1016/S0140-6736(13)60024-0 . - DOI - PubMed
    1. Roper C, Pearce R, Nair S, Sharp B, Nosten F, et al. Intercontinental spread of pyrimethamine-resistant malaria. Science. 2004; 305(5687):1124 10.1126/science.1098876 . - DOI - PubMed
    1. Fairhurst RM. Understanding artemisinin-resistant malaria: what a difference a year makes. Curr Opin Infect Dis. 2015; 28(5):417–25. 10.1097/QCO.0000000000000199 . - DOI - PMC - PubMed
    1. Wootton JC, Feng X, Ferdig MT, Cooper RA, Mu J, et al. Genetic diversity and chloroquine selective sweeps in Plasmodium falciparum . Nature. 2002; 418(6895):320–3. 10.1038/nature00813 . - DOI - PubMed
    1. Carter R, Mendis KN. Evolutionary and historical aspects of the burden of malaria. Clin Microbiol Rev. 2002; 15(4):564–94. 10.1128/CMR.15.4.564-594.2002 - DOI - PMC - PubMed

LinkOut - more resources