

Penetration and distribution of gadolinium-based contrast agents into the cerebrospinal fluid in healthy rats: a potential pathway of entry into the brain tissue
- PMID: 27832312
- PMCID: PMC5486780
- DOI: 10.1007/s00330-016-4654-2
Penetration and distribution of gadolinium-based contrast agents into the cerebrospinal fluid in healthy rats: a potential pathway of entry into the brain tissue
Abstract
Objective: Signal hyperintensity on unenhanced MRI in certain brain regions has been reported after multiple administrations of some, but not all, gadolinium-based contrast agents (GBCAs). One potential initial pathway of GBCA entry into the brain, infiltration from blood into the cerebrospinal fluid (CSF), was systematically evaluated in this preclinical study.
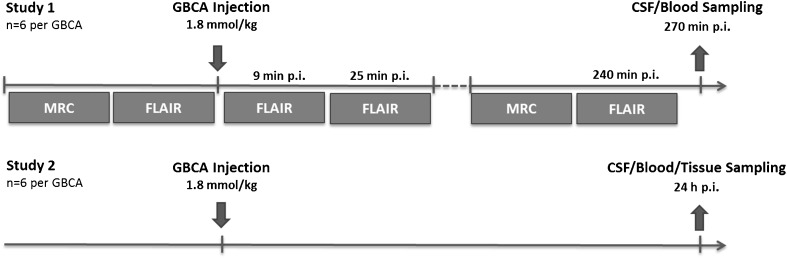
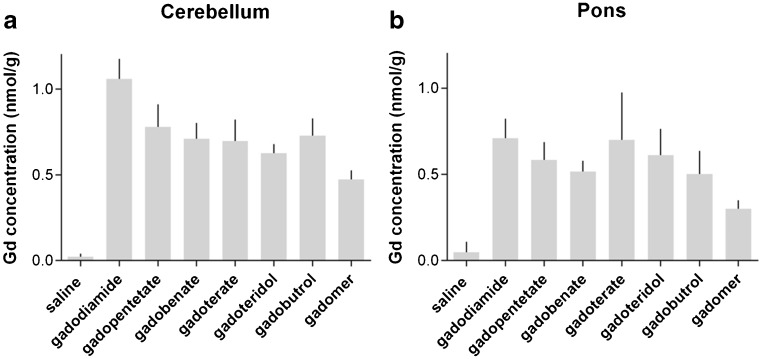
Methods: GBCA infiltration and distribution in the CSF were investigated in healthy rats using repeated fluid-attenuated MRI up to 4 h after high-dose (1.8 mmol/kg) administration of six marketed and one experimental GBCA. Additionally, gadolinium measurements in CSF, blood and brain tissue samples (after 24 h) were performed using inductively coupled plasma mass spectrometry.
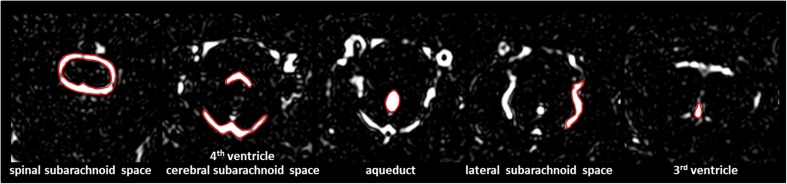
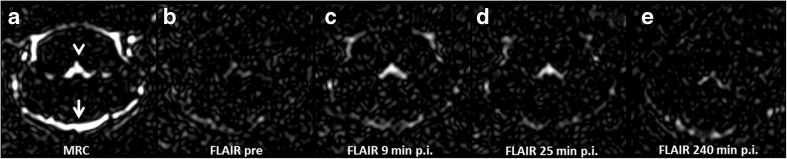
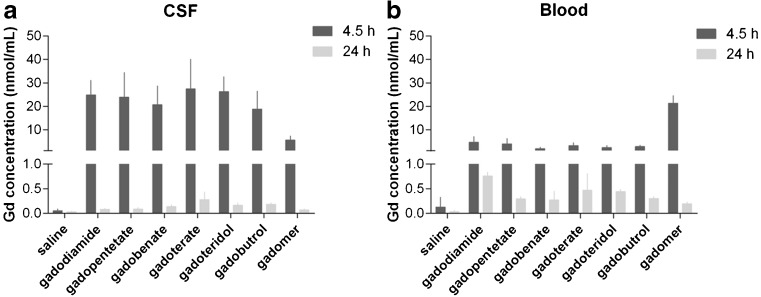
Results: Enhanced MRI signals in the CSF spaces with similar distribution kinetics were observed for all GBCAs. No substantial differences in the gadolinium concentrations among the marketed GBCAs were found in the CSF, blood or brain tissue. After 4.5 h, the concentration in the CSF was clearly higher than in blood but was almost completely cleared and lower than the brain tissue concentration after 24 h.
Conclusions: In contrast to the brain signal hyperintensities, no differences in penetration and distribution into the CSF of healthy rats exist among the marketed GBCAs.
Key points: • Gadolinium-based contrast agents can cross the blood-CSF barrier. • Fluid-attenuated MRI shows GBCA distribution with CSF flow. • GBCA structure and physicochemical properties do not impact CSF penetration and distribution. • GBCA clearance from CSF was almost complete within 24 h in rats. • CSF is a potential pathway of GBCA entry into the brain.
Keywords: Brain; Cerebrospinal fluid; Contrast media; Gadolinium; Magnetic resonance imaging.
Figures

Similar articles
-
Gadolinium Presence in the Brain After Administration of the Liver-Specific Gadolinium-Based Contrast Agent Gadoxetate: A Systematic Comparison to Multipurpose Agents in Rats.Invest Radiol. 2019 Aug;54(8):468-474. doi: 10.1097/RLI.0000000000000559. Invest Radiol. 2019. PMID: 30932931
-
Technical considerations for using intravenous gadolinium-based-contrast-agent (GBCA) based MRI approaches to study cerebrospinal fluid (CSF) circulation and clearance.Neuroimage. 2025 May 15;312:121239. doi: 10.1016/j.neuroimage.2025.121239. Epub 2025 Apr 24. Neuroimage. 2025. PMID: 40280217 Review.
-
Signal Increase on Unenhanced T1-Weighted Images in the Rat Brain After Repeated, Extended Doses of Gadolinium-Based Contrast Agents: Comparison of Linear and Macrocyclic Agents.Invest Radiol. 2016 Feb;51(2):83-9. doi: 10.1097/RLI.0000000000000242. Invest Radiol. 2016. PMID: 26606548 Free PMC article.
-
Histology and Gadolinium Distribution in the Rodent Brain After the Administration of Cumulative High Doses of Linear and Macrocyclic Gadolinium-Based Contrast Agents.Invest Radiol. 2017 Jun;52(6):324-333. doi: 10.1097/RLI.0000000000000344. Invest Radiol. 2017. PMID: 28323657 Free PMC article.
-
Gadolinium deposition within the dentate nucleus and globus pallidus after repeated administrations of gadolinium-based contrast agents-current status.Neuroradiology. 2016 May;58(5):433-41. doi: 10.1007/s00234-016-1658-1. Epub 2016 Feb 12. Neuroradiology. 2016. PMID: 26873830 Review.
Cited by
-
Comprehensive Analysis of the Spatial Distribution of Gadolinium, Iron, Manganese, and Phosphorus in the Brain of Healthy Rats After High-Dose Administrations of Gadodiamide and Gadobutrol.Invest Radiol. 2024 Feb 1;59(2):150-164. doi: 10.1097/RLI.0000000000001054. Epub 2023 Dec 30. Invest Radiol. 2024. PMID: 38157437 Free PMC article.
-
Gadolinium retention in the body: what we know and what we can do.Radiol Med. 2017 Aug;122(8):589-600. doi: 10.1007/s11547-017-0757-3. Epub 2017 Mar 30. Radiol Med. 2017. PMID: 28361260 Review.
-
Intrathecal Use of Gadobutrol for Glymphatic MR Imaging: Prospective Safety Study of 100 Patients.AJNR Am J Neuroradiol. 2019 Aug;40(8):1257-1264. doi: 10.3174/ajnr.A6136. Epub 2019 Jul 18. AJNR Am J Neuroradiol. 2019. PMID: 31320462 Free PMC article.
-
Appearance of the Organum Vasculosum of the Lamina Terminalis on Contrast-enhanced MR Imaging.Magn Reson Med Sci. 2018 Apr 10;17(2):132-137. doi: 10.2463/mrms.mp.2017-0088. Epub 2017 Sep 29. Magn Reson Med Sci. 2018. PMID: 28966303 Free PMC article.
-
Imaging of brain barrier inflammation and brain fluid drainage in human neurological diseases.Cell Mol Life Sci. 2024 Jan 12;81(1):31. doi: 10.1007/s00018-023-05073-3. Cell Mol Life Sci. 2024. PMID: 38212566 Free PMC article. Review.
References
-
- Kanda T, Ishii K, Kawaguchi H, Kitajima K, Takenaka D. High signal intensity in the dentate nucleus and globus pallidus on unenhanced T1-weighted MR images: relationship with increasing cumulative dose of a gadolinium-based contrast material. Radiology. 2014;270:834–841. doi: 10.1148/radiol.13131669. - DOI - PubMed
-
- Errante Y, Cirimele V, Mallio CA, Di Lazzaro V, Zobel BB, Quattrocchi CC. Progressive increase of T1 signal intensity of the dentate nucleus on unenhanced magnetic resonance images is associated with cumulative doses of intravenously administered gadodiamide in patients with normal renal function, suggesting dechelation. Investig Radiol. 2014;49:685–690. doi: 10.1097/RLI.0000000000000072. - DOI - PubMed
MeSH terms
Substances
LinkOut - more resources
Full Text Sources
Other Literature Sources
Medical
