. 2016 Nov 9;20(5):584-595.
doi: 10.1016/j.chom.2016.10.007.

The Salmonella Effector SteD Mediates MARCH8-Dependent Ubiquitination of MHC II Molecules and Inhibits T Cell Activation

Affiliations

The Salmonella Effector SteD Mediates MARCH8-Dependent Ubiquitination of MHC II Molecules and Inhibits T Cell Activation

Ethel Bayer-Santos et al. Cell Host Microbe. .

Abstract

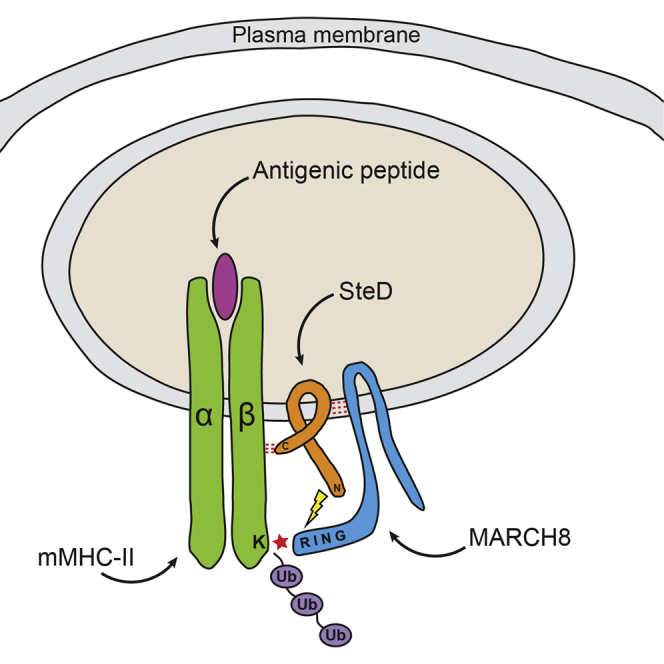
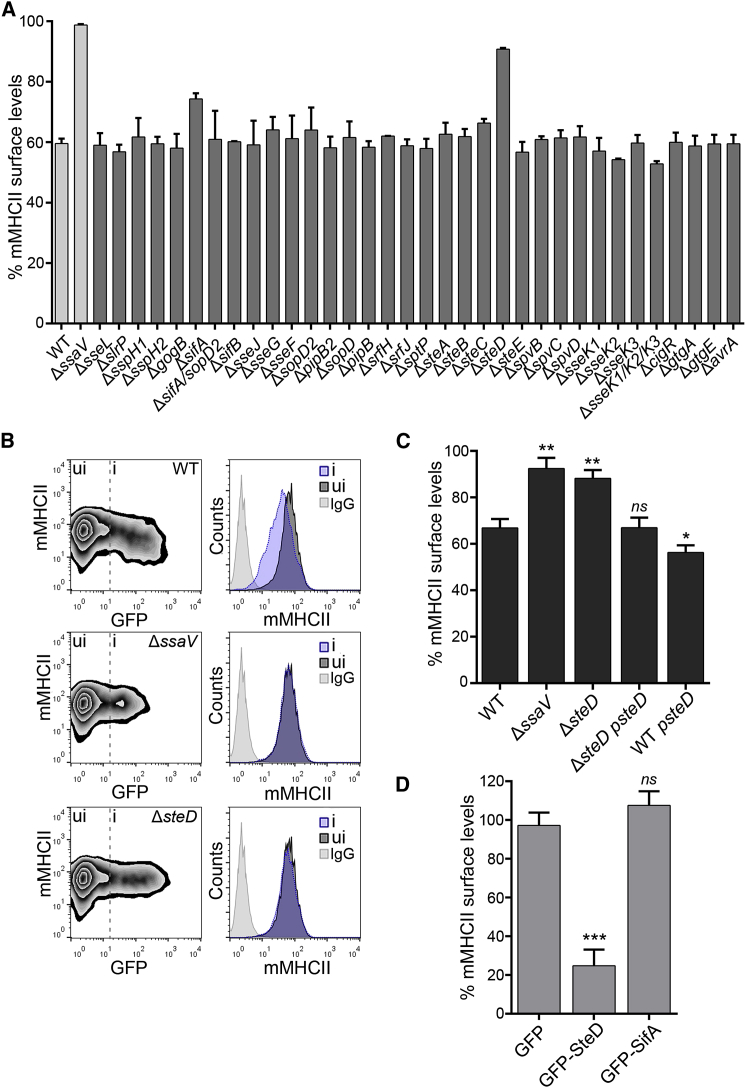
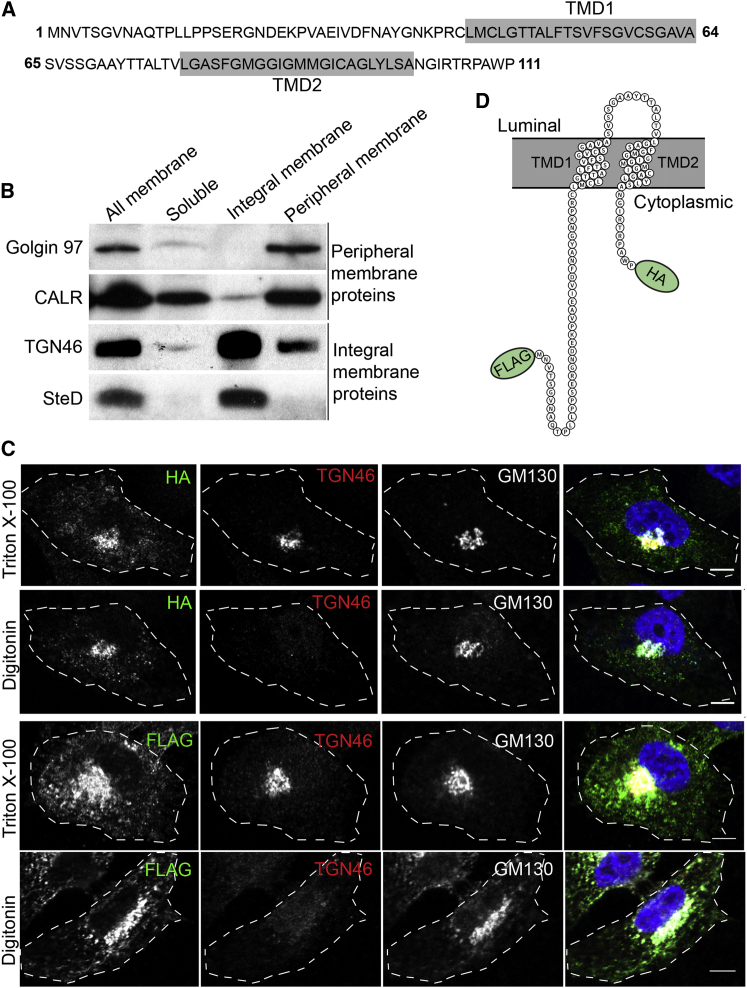
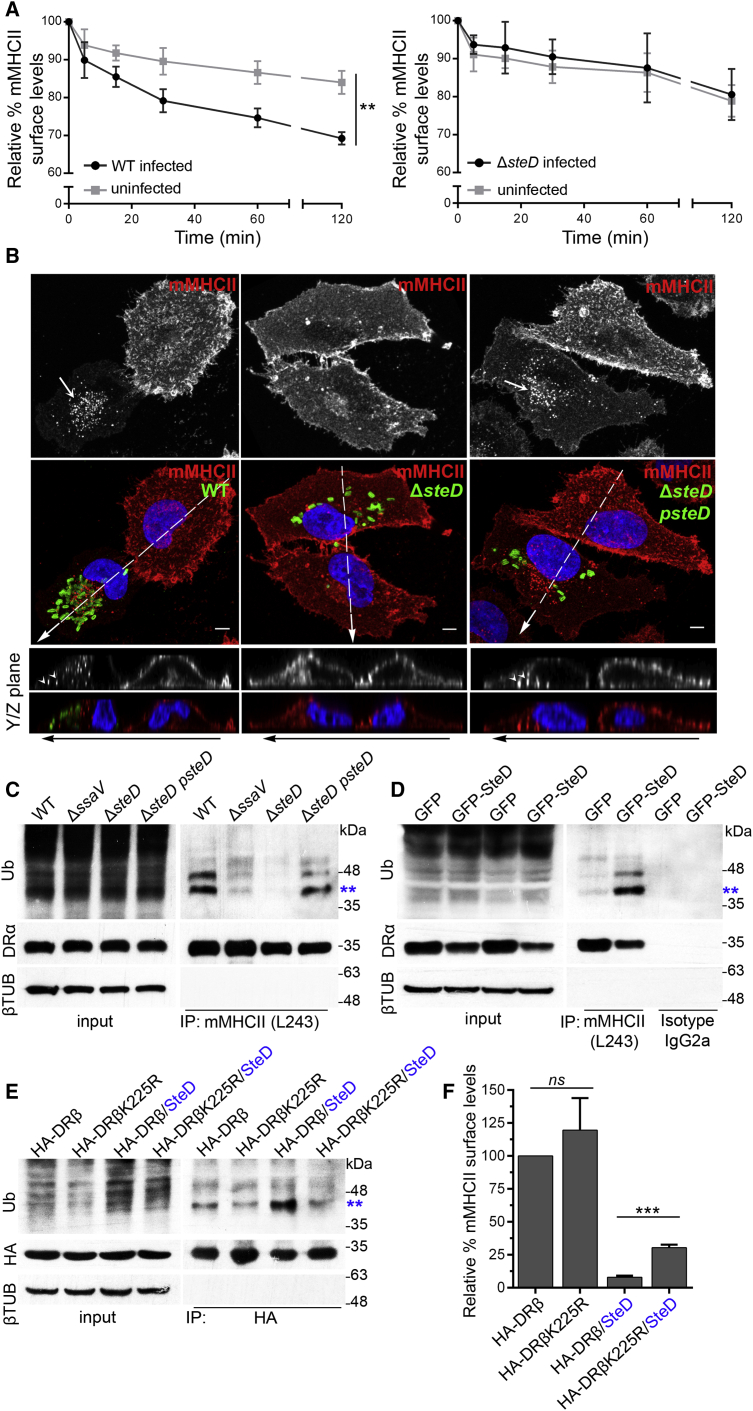
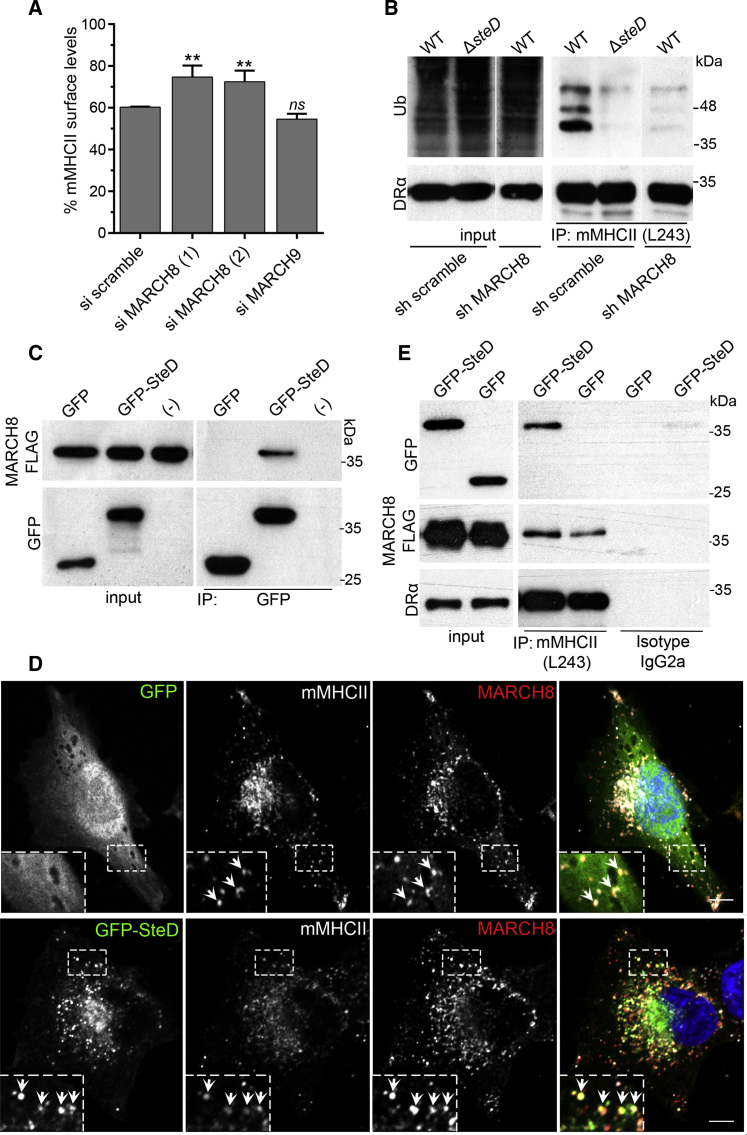
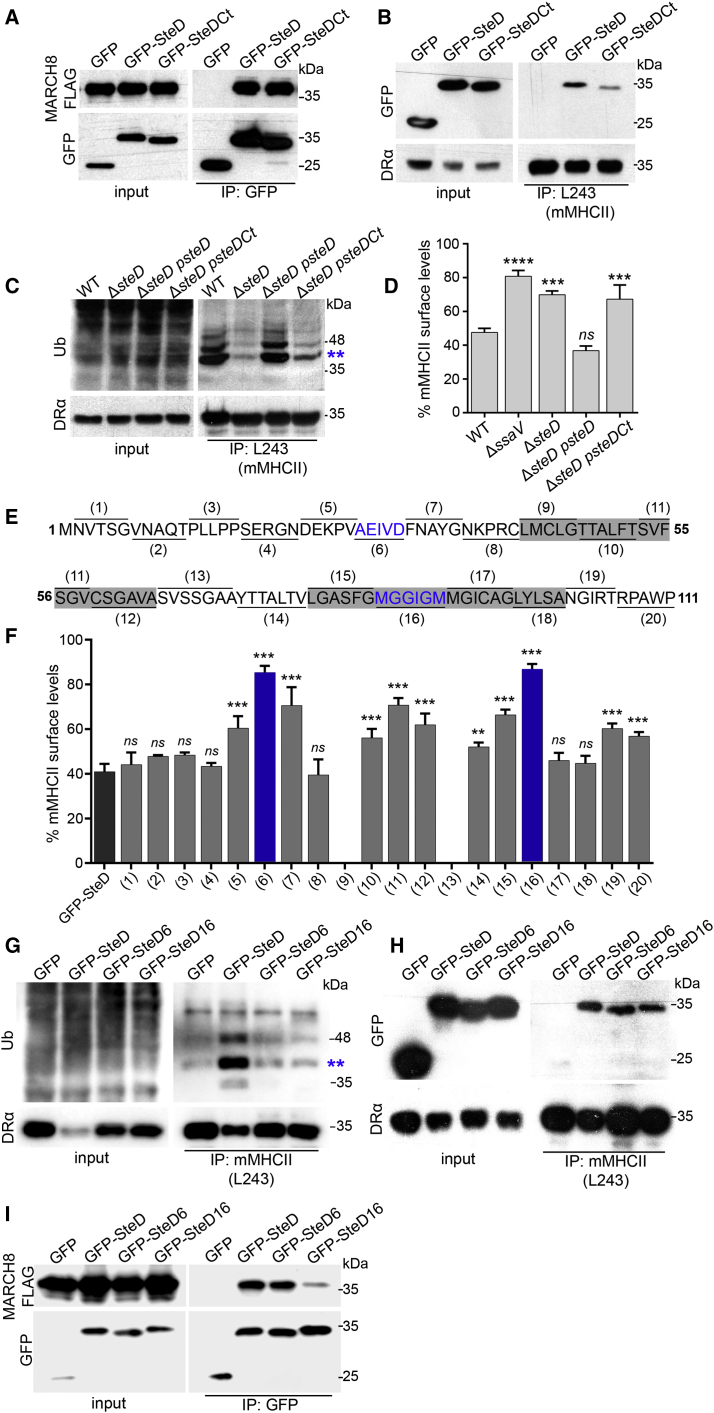
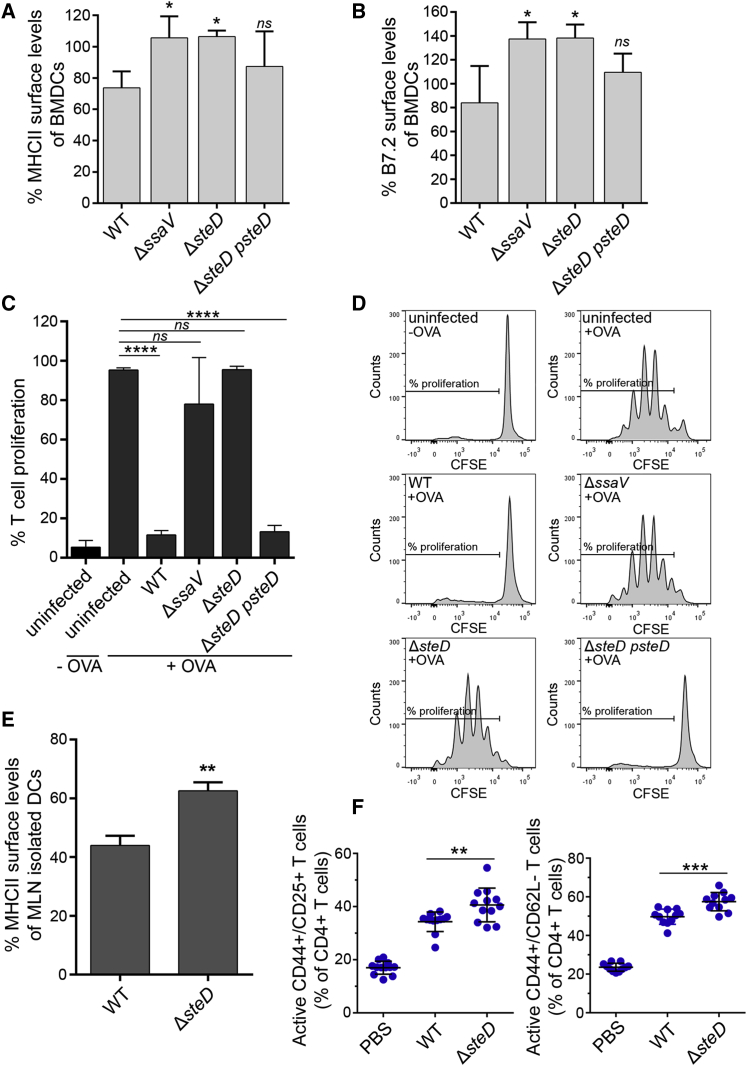
The SPI-2 type III secretion system (T3SS) of intracellular Salmonella enterica translocates effector proteins into mammalian cells. Infection of antigen-presenting cells results in SPI-2 T3SS-dependent ubiquitination and reduction of surface-localized mature MHC class II (mMHCII). We identify the effector SteD as required and sufficient for this process. In Mel Juso cells, SteD localized to the Golgi network and vesicles containing the E3 ubiquitin ligase MARCH8 and mMHCII. SteD caused MARCH8-dependent ubiquitination and depletion of surface mMHCII. One of two transmembrane domains and the C-terminal cytoplasmic region of SteD mediated binding to MARCH8 and mMHCII, respectively. Infection of dendritic cells resulted in SteD-dependent depletion of surface MHCII, the co-stimulatory molecule B7.2, and suppression of T cell activation. SteD also accounted for suppression of T cell activation during Salmonella infection of mice. We propose that SteD is an adaptor, forcing inappropriate ubiquitination of mMHCII by MARCH8 and thereby suppressing T cell activation.

Keywords: Salmonella; dendritic cells; effector; ligase; major histocompatibility complex; ubiquitin.


Figures

None
Graphical abstract
Figure 1
Figure 1
Salmonella SPI-2 T3SS Effector SteD Reduces Surface Levels of Mature MHCII Molecules (A) Mel Juso cells were infected with WT or mutant Salmonella strains for 16 hr and surface levels of mMHCII were measured by flow cytometry using mAb L243 (that specifically recognizes mature HLA-DR). The error bars represent SD of the geometric mean fluorescence of two independent experiments performed in duplicate. (B) Representative FACS plots showing surface levels of mMHCII in infected cells (i) compared to uninfected cells (ui). The histograms show surface levels of mMHCII in infected (i, blue) and uninfected (ui, dark gray) cells. The cells labeled with isotype control antibody are shown in light gray. (C) Mel Juso cells were infected with ΔsteD strain carrying pWSK29, expressing SteD-2HA regulated by its endogenous promoter (psteD). The infected and uninfected cells were discriminated using anti-Salmonella CSA-1 antibody after fixation. The data represent surface levels of mMHCII in infected cells as a percentage of those in uninfected cells from the same sample. (D) Mel Juso cells were transfected with vectors encoding GFP-tagged effectors, and mMHCII was analyzed by flow cytometry. The data represent surface levels of mMHCII in transfected cells as a percentage of those in untransfected cells from the same sample. (C and D) Error bars represent SD of the geometric mean fluorescence of three experiments done in duplicate and were analyzed through comparison with WT Salmonella (C) or GFP-only transfected cells (D) by one-way ANOVA followed by Dunnett’s multiple comparison test. ∗∗∗p < 0.001, ∗∗p < 0.01, p < 0.05, and not significant, ns.
Figure 2
Figure 2
SteD Is an Integral Membrane Protein and Both the N- and C-termini Are Exposed to the Host Cell Cytosol (A) Amino acid sequence of SteD showing transmembrane domains (TMD) predicted by TMHMM 2.0 software shaded in gray. (B) Membrane fractionation of Mel Juso cells infected for 20 hr with ΔsteD psteD-2HA. The soluble proteins were separated from total membrane proteins, which were later treated with 2.5 M urea to discriminate between the integral membrane and membrane-associated proteins by ultracentrifugation. Calreticulin (CALR) and Golgin 97 are membrane-associated proteins and TGN46 is an integral Golgi membrane protein. (C) Mel Juso cells were infected with ΔsteD psteD-2HA (top two panels) or transfected with vector encoding SteD fused at its N terminus to FLAG epitope (FLAG-SteD) (bottom two panels). The cells were semi- or completely permeabilized with digitonin or Triton X-100 to discriminate between cytoplasmic and Golgi luminal antigens, respectively. The antibodies recognizing the luminal portion of TGN46 or cytoplasmic GM130 were used as controls. The scale bar represents 5 μm. (D) Schematic representation of SteD topology in the membrane (Protter 1.0 software; Omasits et al., 2014).
Figure 3
Figure 3
SteD Depletes Surface Levels of mMHCII and Increases Its Ubiquitination (A) Flow cytometry analysis showing surface mMHCII in Mel Juso cells infected with WT-GFP or ΔsteD-GFP strains compared to uninfected cells. The cells were infected for 16 hr and then labeled with mAb L243 on ice for 30 min to block internalization. The cells were exposed to 37°C to enable resumption of internalization. The surface levels of mMHCII at various time points were normalized to those at the time of transfer to 37°C (0 min), which represents 100%. (B) Cells at 16 hr post invasion were labeled with mAb L243 on ice and incubated for another 4 hr in complete medium at 37°C. The cells were fixed and processed for immunofluorescence microscopy with DAPI nuclear stain (blue), anti-Salmonella CSA-1 (green), and anti-mouse secondary antibody against L243 (red). The images are maximum intensity Z projections showing the difference in mMHCII surface levels between cells infected with WT or ΔsteD psteD and its intracellular accumulation (arrows). The scale bar represents 5 μm. The regions indicated by white dashed lines of Z projections are shown below in the YZ plane. The internalized mMHCII in cells infected with WT or ΔsteD psteD strains are indicated by arrowheads. (C) Mel Juso cells were infected at an MOI of 300:1 and at 16 hr post invasion lysed for immunoprecipitation with mAb L243 followed by western blot analysis with anti-ubiquitin (P4D1-HRP), anti-DRα, and anti-β tubulin antibodies. (D) Stable Mel Juso cell lines expressing GFP or GFP-SteD were lysed and mAb L243 or IgG2a isotype control was used for immunoprecipitation. The immunoprecipitates were analyzed by western blot with the same antibodies as in (C). (E) HA-tagged DRβ constructs (either wild-type [HA-DRβ] or with an arginine substitution of lysine 225 on DRβ cytoplasmic tail [HA-DRβ K225R]) were used to transduce Mel Juso cells or stable cells expressing GFP-SteD. The cells were lysed and immunoprecipitated with anti-HA antibody coupled to agarose beads followed by western blot analysis with anti-HA, anti-ubiquitin (P4D1-HRP), and anti-β tubulin antibodies. The blot shown is representative of three separate experiments in which band intensities, normalized to corresponding HA bands, are 1.00 ± 0.02 (DRβ), 0.59 ± 0.06 (DRβK225), 1.42 ± 0.44 (DRβ/SteD), and 0.50 ± 0.13 (DRβK225/SteD) (Student’s t test p < 0.03, comparison between DRβ/SteD and DRβK225/SteD). Double asterisks in (C)–(E) denote di-ubiquitinated DRβ. (F) Surface levels of mMHCII on stable cells described in (E), measured by mAb L243 labeling and flow cytometry. The data shown are surface levels of mMHCII relative to that in cells expressing HA-DRβ. ∗∗∗p < 0.001, ∗∗p < 0.01, and not significant, ns (Student’s t test). The data shown are surface levels of mMHCII relative to that in cells expressing HA-DRβ.
Figure 4
Figure 4
Interactions between SteD, MARCH8, and mMHCII (A) Flow cytometry analysis of Mel Juso cells that were treated with siRNA prior to infection with WT-GFP Salmonella. The data represent surface levels of mMHCII in infected cells as a percentage of those in uninfected cells from the same sample and are the means ± SD from three independent experiments. (B) Mel Juso cells transduced with shRNA to knockdown MARCH8 or a scramble control were infected at an MOI of 300:1 and at 16 hr post invasion lysed for immunoprecipitation with mAb L243 followed by western blot analysis with anti-ubiquitin (P4D1-HRP) and anti-DRα. sh MARCH8 and sh scramble images after immunoprecipitation (IP) are from the same blot and exposure. (C) HEK293T cells transfected with vectors expressing MARCH8-FLAG and GFP-SteD or GFP alone were used for immunoprecipitation with GFP-Trap beads. (−) indicates MARCH8-FLAG alone. The immunoprecipitates were analyzed by western blot using anti-GFP and anti-FLAG antibodies. (D) Stable Mel Juso cells expressing GFP-SteD and MARCH8-FLAG were analyzed by immunofluorescence with anti-FLAG (red) and mAb L243 against mMHCII (gray), the arrows indicate vesicles in which the three proteins co-localized. The scale bar represents 5 μm. (E) Stable Mel Juso cell lines expressing both MARCH8-FLAG and GFP-SteD or MARCH8-FLAG and GFP alone were used for immunoprecipitation with mAb L243 (for mMHCII) or isotype control. The immunoprecipitates were analyzed by western blot using anti-GFP, anti-FLAG, and anti-DRα antibodies. The samples in (A) were compared to siRNA scramble by one-way ANOVA followed by Dunnett’s multiple comparison test. ∗∗p < 0.01 and not significant, ns.
Figure 5
Figure 5
Mutational Analysis of SteD (A) HEK293T cells transfected with vectors expressing MARCH8-FLAG and GFP, GFP-SteD, or GFP-SteDCt were used for immunoprecipitation with GFP-Trap beads and analyzed by western blot with anti-GFP and anti-FLAG antibodies. (B) Stable Mel Juso cell lines expressing GFP, GFP-SteD, and GFP-SteDCt were used for immunoprecipitation with mAb L243 (for mMHCII). The immunoprecipitates were analyzed by western blot with anti-GFP and anti-DRα antibodies. The blot shown is representative of three separate experiments in which the mean intensity of GFP-SteDCt compared to GFP-SteD after immunoprecipitation was 0.21 ± 0.14 (p < 0.02). (C) Mel Juso cells were infected at an MOI of 300:1 and at 16 hr post invasion lysed for immunoprecipitation with mAb L243 followed by western blot analysis with anti-ubiquitin (P4D1-HRP) and anti-DRα antibodies. (D) Mel Juso cells were transfected with vectors encoding GFP, GFP-SteD, and GFP-SteDCt, and mMHCII surface levels were analyzed by flow cytometry. The data represent surface levels of mMHCII in transfected cells as a percentage of those in untransfected cells from the same sample and are the means ± SD from three independent experiments. (E) Schematic representation of SteD amino acids substituted with alanine. The transmembrane regions are shaded in gray. (F) Mel Juso cells were transfected with vectors encoding mutated versions of SteD fused to GFP, and mMHCII surface levels were analyzed by flow cytometry. The data were analyzed as for (D) above. (G) Stable Mel Juso cell lines expressing GFP, GFP-SteD, GFP-SteD6, or GFP-SteD16 were lysed and mAb L243 was used for immunoprecipitation and analysis as in (C). (H) The stable cells used in (G) were used for immunoprecipitation with mAb L243 (for mMHCII) and analyzed as in (B). (I) HEK293T cells transfected with vectors expressing MARCH8-FLAG and GFP, GFP-SteD, GFP-SteD6, or GFP-SteD16 were used for immunoprecipitation with GFP-Trap beads and analyzed as in (A). The blot shown is representative of three separate experiments in which the mean intensity of GFP-SteD16 compared to GFP-SteD after immunoprecipitation was 0.12 ± 0.07 (p < 0.02). The data in (D) and (F) were compared to GFP-SteD by one-way ANOVA followed by Dunnett’s multiple comparison test. ∗∗∗∗p < 0.0001, ∗∗∗p < 0.001, ∗∗p < 0.01, and not significant, ns.
Figure 6
Figure 6
SteD Suppresses T Cell Proliferation (A) Mouse BMDCs were infected with the indicated bacterial strains and total MHCII surface levels (I-A/I-E haplotypes) were quantified by flow cytometry at 20 hr post uptake. (B) BMDCs were infected as in (A), and B7.2 surface levels were quantified by flow cytometry at 20 hr post uptake. (A and B) Surface levels of proteins in infected cells are represented as a percentage of those in uninfected cells from the same sample and are the means ± SD from four independent experiments. (C) Infected BMDCs were incubated with OVA peptide and co-cultured with T cells labeled with CFSE for 3 days. T cell proliferation was analyzed by flow cytometry after labeling cells with anti-CD3, anti-V alpha2, and anti-CD4 antibodies. The uninfected BMDCs incubated or not with OVA-peptide were used as controls. The results shown represent the % of T cells that proliferated and are the means ± SD from quadruplicate samples in three independent experiments. (D) Representative FACS histograms showing T cell proliferation measured by CFSE levels in different conditions. (E) Dendritic cells from mesenteric lymph nodes of mice infected with WT-GFP or ΔsteD-GFP Salmonella by oral gavage were isolated at 48 hr post inoculation and total MHCII surface levels were measured by flow cytometry. The data represent surface levels of MHCII in infected BMDCs as a percentage of those in uninfected cells from the same sample and are the means ± SD from three independent experiments. (F) Activated T cells (CD25+CD44+ and CD62L−CD44+) as a percentage of total CD4+ T cells isolated from the spleens of mice infected by Salmonella WT or ΔsteD strains at day 17 post inoculation. The data in (A) and (B) were analyzed by comparison with WT and in (C) by comparison with uninfected +OVA by one-way ANOVA followed by Dunnett’s multiple comparison test. The data in (E) were analyzed by Student’s t test. The data in (F) were analyzed by two-tailed pairwise t test using pairs shown in Table S2. ∗∗∗∗p < 0.0001, ∗∗p < 0.01, p < 0.02, and not significant, ns.

Comment in

Similar articles

Cited by

References

    1. Ashida H., Kim M., Sasakawa C. Exploitation of the host ubiquitin system by human bacterial pathogens. Nat. Rev. Microbiol. 2014;12:399–413. - PubMed
    1. Bartee E., Mansouri M., Hovey Nerenberg B.T., Gouveia K., Früh K. Downregulation of major histocompatibility complex class I by human ubiquitin ligases related to viral immune evasion proteins. J. Virol. 2004;78:1109–1120. - PMC - PubMed
    1. Bijlmakers M.J., Benaroch P., Ploegh H.L. Assembly of HLA DR1 molecules translated in vitro: binding of peptide in the endoplasmic reticulum precludes association with invariant chain. EMBO J. 1994;13:2699–2707. - PMC - PubMed
    1. Cheminay C., Möhlenbrink A., Hensel M. Intracellular Salmonella inhibit antigen presentation by dendritic cells. J. Immunol. 2005;174:2892–2899. - PubMed
    1. Cho K.J., Walseng E., Ishido S., Roche P.A. Ubiquitination by March-I prevents MHC class II recycling and promotes MHC class II turnover in antigen-presenting cells. Proc. Natl. Acad. Sci. USA. 2015;112:10449–10454. - PMC - PubMed

Substances