Go-activation endures following the presentation of a stop-signal: evidence from startle
- PMID: 27832599
- PMCID: PMC5253401
- DOI: 10.1152/jn.00567.2016
Go-activation endures following the presentation of a stop-signal: evidence from startle
Abstract
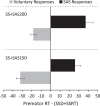
It has been proposed that, in a stop-signal task (SST), independent go- and stop-processes "race" to control behavior. If the go-process wins, an overt response is produced, whereas, if the stop-process wins, the response is withheld. One prediction that follows from this proposal is that, if the activation associated with one process is enhanced, it is more likely to win the race. We looked to determine whether these initiation and inhibition processes (and thus response outcomes) could be manipulated by using a startling acoustic stimulus (SAS), which has been shown to provide additional response activation. In the present study, participants were to respond to a visual go-stimulus; however, if a subsequent stop-signal appeared, they were to inhibit the response. The stop-signal was presented at a delay corresponding to a probability of responding of 0.4 (determined from a baseline block of trials). On stop-trials, a SAS was presented either simultaneously with the go-signal or stop-signal or 100, 150, or 200 ms following the stop-signal. Results showed that presenting a SAS during stop-trials led to an increase in probability of responding when presented with or following the stop-signal. The latency of SAS responses at the stop-signal + 150 ms and stop-signal + 200 ms probe times suggests that they would have been voluntarily inhibited but instead were involuntarily initiated by the SAS. Thus results demonstrate that go-activation endures even 200 ms following a stop-signal and remains accessible well after the response has been inhibited, providing evidence against a winner-take-all race between independent go- and stop-processes.
New & noteworthy: In this study, a startling acoustic stimulus (SAS) was used to determine whether response outcome could be manipulated in a stop-signal task. Results revealed that presenting a SAS during stop-signal trials led to an increase in probability of responding even when presented 200 ms following the stop-signal. The latency of SAS responses indicates that go-activation remains accessible and modifiable well after the response is voluntarily inhibited, providing evidence against an irrevocable commitment to inhibition.
Keywords: inhibition; initiation; response activation; startling acoustic stimulus; stop-signal task.
Copyright © 2017 the American Physiological Society.
Figures


Similar articles
-
Startle reveals decreased response preparatory activation during a stop-signal task.J Neurophysiol. 2016 Sep 1;116(3):986-94. doi: 10.1152/jn.00216.2016. Epub 2016 Jun 8. J Neurophysiol. 2016. PMID: 27281747 Free PMC article.
-
Foreknowledge of an impending startling stimulus does not affect the proportion of startle reflexes or latency of StartReact responses.Exp Brain Res. 2017 Feb;235(2):379-388. doi: 10.1007/s00221-016-4795-1. Epub 2016 Oct 13. Exp Brain Res. 2017. PMID: 27738717
-
Investigation of timing preparation during response initiation and execution using a startling acoustic stimulus.Exp Brain Res. 2017 Jan;235(1):15-27. doi: 10.1007/s00221-016-4774-6. Epub 2016 Sep 10. Exp Brain Res. 2017. PMID: 27614459
-
Partial response electromyography as a marker of action stopping.Elife. 2022 May 26;11:e70332. doi: 10.7554/eLife.70332. Elife. 2022. PMID: 35617120 Free PMC article. Review.
-
Models of response inhibition in the stop-signal and stop-change paradigms.Neurosci Biobehav Rev. 2009 May;33(5):647-61. doi: 10.1016/j.neubiorev.2008.08.014. Epub 2008 Sep 4. Neurosci Biobehav Rev. 2009. PMID: 18822313 Free PMC article. Review.
Cited by
-
Response inhibition in premotor cortex corresponds to a complex reshuffle of the mesoscopic information network.Netw Neurosci. 2024 Jul 1;8(2):597-622. doi: 10.1162/netn_a_00365. eCollection 2024. Netw Neurosci. 2024. PMID: 38952814 Free PMC article.
-
The Existence of the StartReact Effect Implies Reticulospinal, Not Corticospinal, Inputs Dominate Drive to Motoneurons during Voluntary Movement.J Neurosci. 2022 Oct 5;42(40):7634-7647. doi: 10.1523/JNEUROSCI.2473-21.2022. Epub 2022 Sep 2. J Neurosci. 2022. PMID: 36658461 Free PMC article.
References
-
- Badry R, Mima T, Aso T, Nakatsuka M, Abe M, Fathi D, Foly N, Nagiub H, Nagamine T, Fukuyama H. Suppression of human cortico-motoneuronal excitability during the Stop-signal task. Clin Neurophysiol 120: 1717–1723, 2009. - PubMed
-
- Band GP, van der Molen MW, Logan GD. Horse-race model simulations of the stop-signal procedure. Acta Psychol (Amst) 112: 105–142, 2003. - PubMed
-
- Boucher L, Palmeri TJ, Logan GD, Schall JD. Inhibitory control in mind and brain: An interactive race model of countermanding Saccades. Psychol Rev 114: 376–397, 2007. - PubMed
MeSH terms
LinkOut - more resources
Full Text Sources
Other Literature Sources
Miscellaneous

