

Microparticles and Nanoparticles Delivered in Intravenous Saline and in an Intravenous Solution of a Therapeutic Antibody Product
- PMID: 27832839
- PMCID: PMC5237601
- DOI: 10.1016/j.xphs.2016.09.028
Microparticles and Nanoparticles Delivered in Intravenous Saline and in an Intravenous Solution of a Therapeutic Antibody Product
Abstract
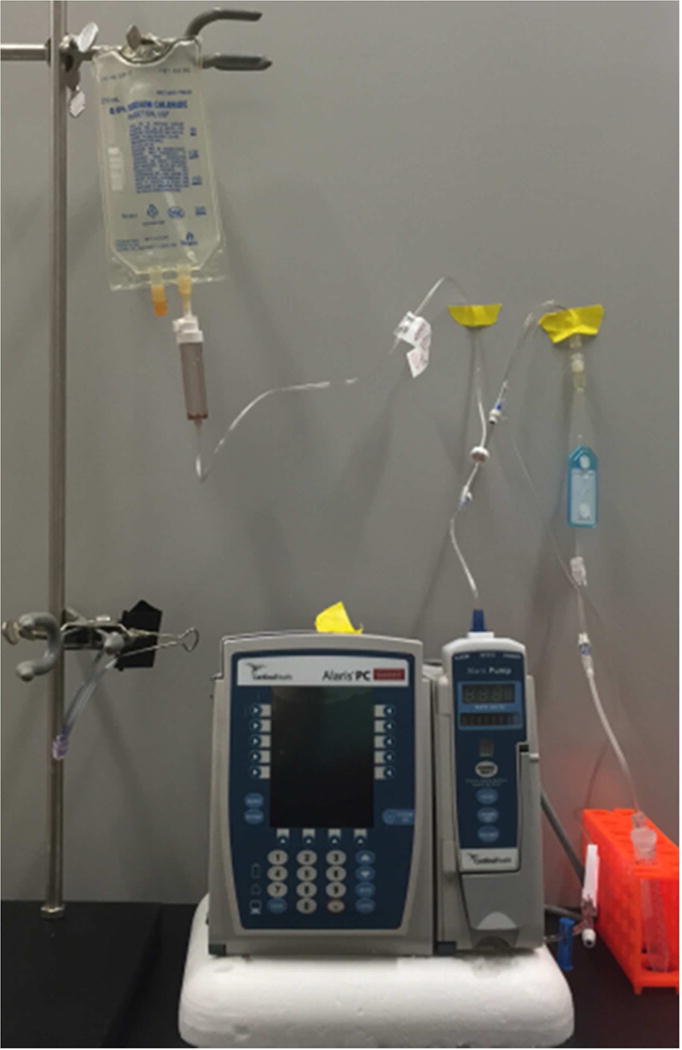
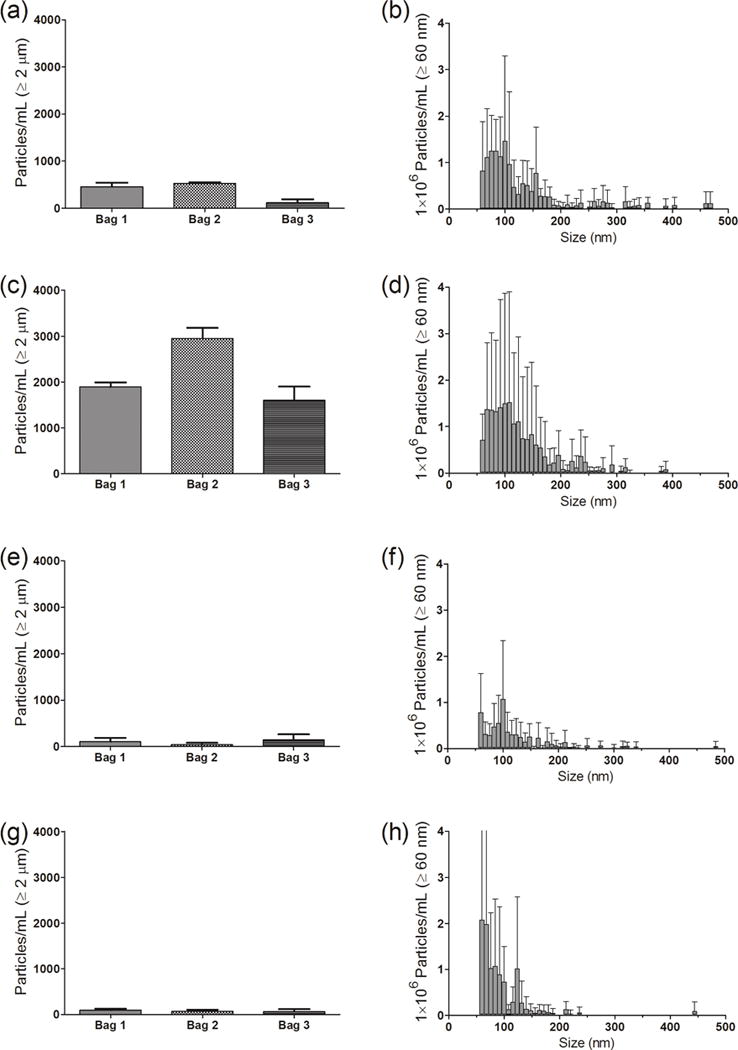
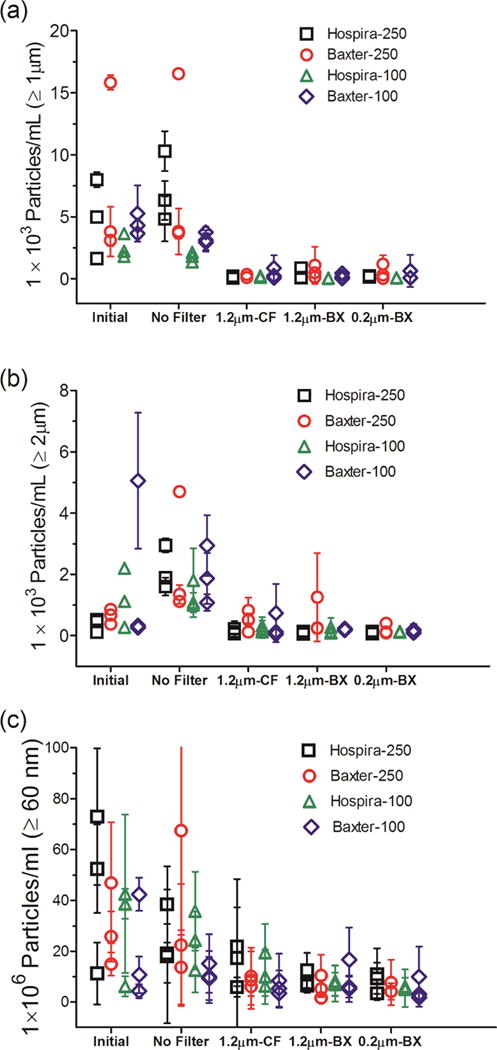
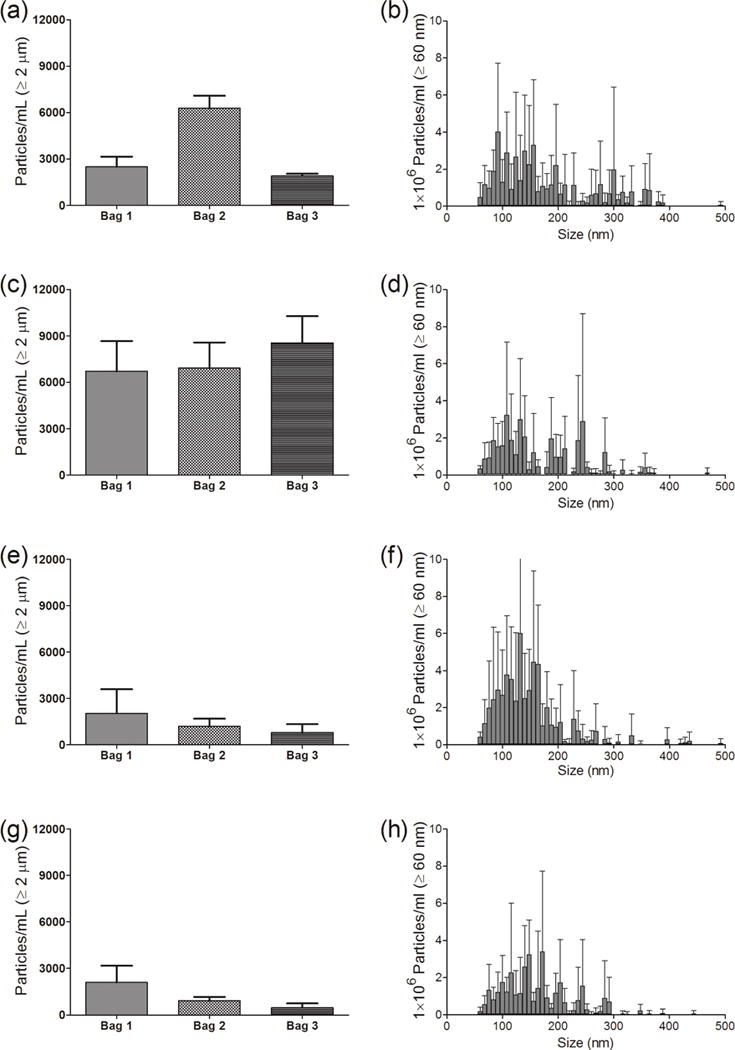
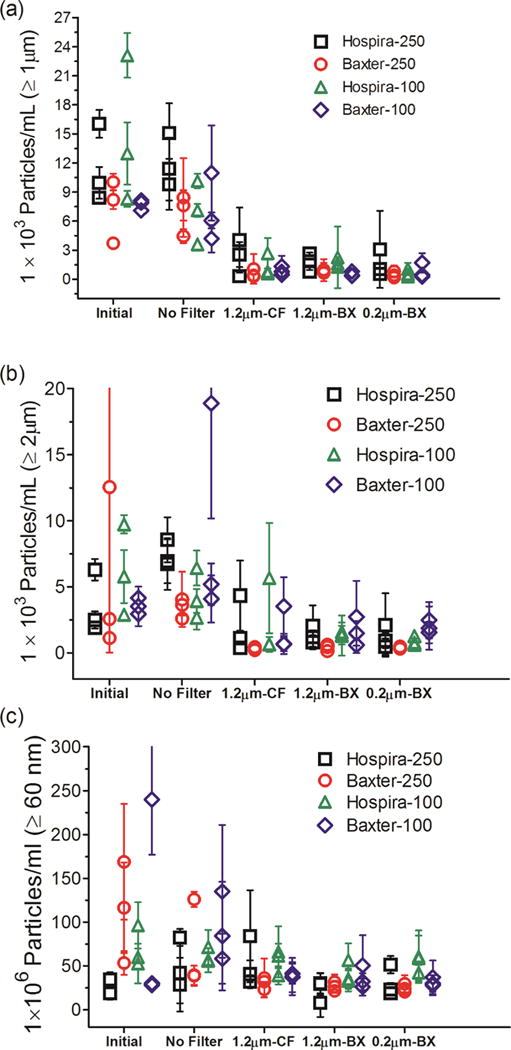
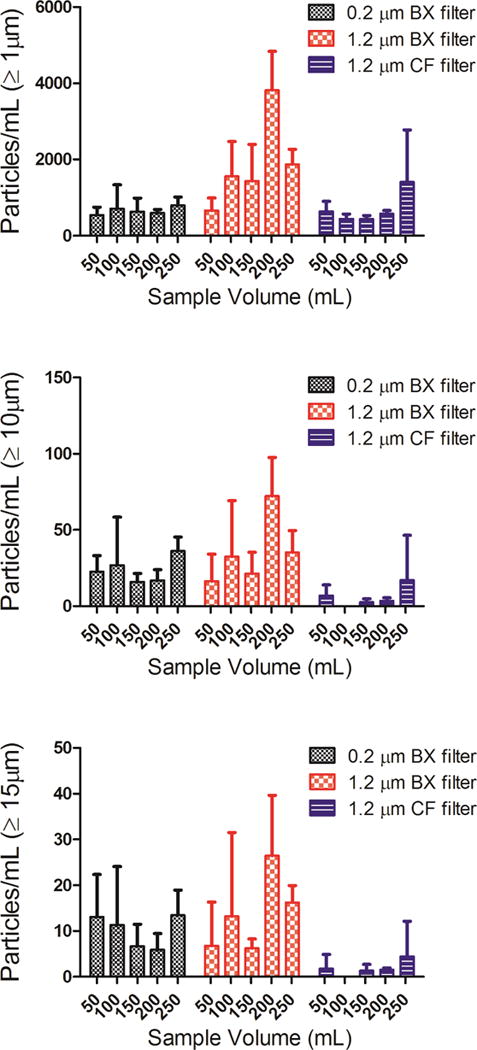
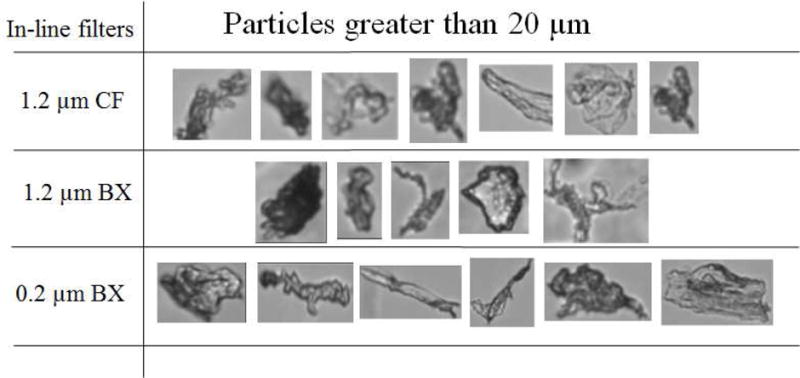
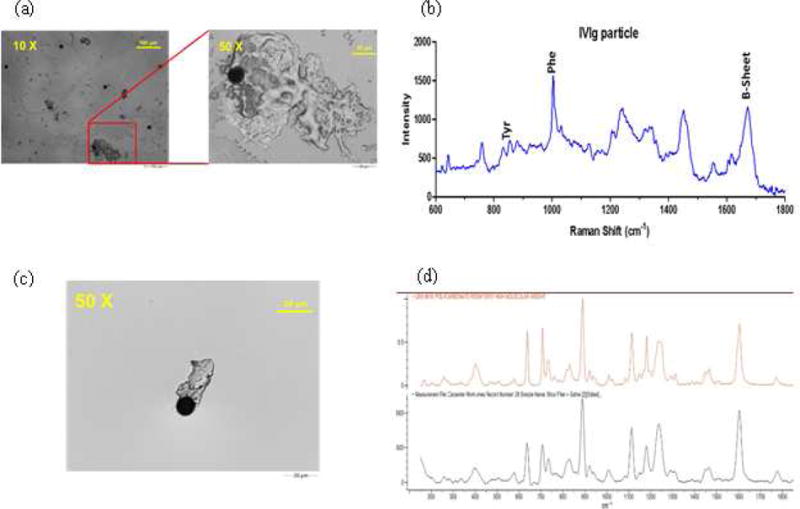
Intravenous (IV) infusion is used for administration of a large proportion of biologic therapeutics, including most monoclonal antibody products. In this study, we determined the subvisible particle levels in IV solutions and after the solutions were processed with an IV administration setup that mimicked the typical clinical method of administration. IV saline in bags manufactured by both Hospira and Baxter contained 1600-8000 microparticles/mL and 4-73 × 106 nanoparticles/mL in solution. When IV immunoglobulin was diluted into the IV saline, 3700-23,000 microparticles/mL and 18-240 × 106 nanoparticles/mL were detected. During processing of the solution through the IV system, in-line filters removed most microparticles. However, there were still 1-21 × 106 nanoparticles/mL in IV saline and 7-83 × 106 nanoparticles/mL in IV immunoglobulin diluted in saline. Finally, in samples processed through in-line filters, we found relatively large microparticles (20-60 μm) that were composed of protein or polycarbonate. These particles resulted from shedding of polycarbonate and sloughing off of protein films downstream from the filter membrane. Overall, the results document that even with in-line filters in place, high levels of subvisible particles are delivered to patients and there is a need for improved, more effective filters and IV solutions with lower particle levels.
Keywords: IgG antibody; adsorption; microparticles; nanoparticles; particle size; protein aggregation; protein delivery.
Copyright © 2017 American Pharmacists Association®. Published by Elsevier Inc. All rights reserved.
Figures
Similar articles
-
Compatibility, physical stability, and characterization of an IgG4 monoclonal antibody after dilution into different intravenous administration bags.J Pharm Sci. 2012 Oct;101(10):3636-50. doi: 10.1002/jps.23224. Epub 2012 Jun 25. J Pharm Sci. 2012. PMID: 22733600
-
Monoclonal antibody interactions with micro- and nanoparticles: adsorption, aggregation, and accelerated stress studies.J Pharm Sci. 2009 Sep;98(9):3218-38. doi: 10.1002/jps.21768. J Pharm Sci. 2009. PMID: 19492408 Free PMC article.
-
No Touching! Abrasion of Adsorbed Protein Is the Root Cause of Subvisible Particle Formation During Stirring.J Pharm Sci. 2016 Feb;105(2):519-529. doi: 10.1016/j.xphs.2015.10.003. Epub 2016 Jan 12. J Pharm Sci. 2016. PMID: 26869415
-
Subvisible (2-100 μm) Particle Analysis During Biotherapeutic Drug Product Development: Part 1, Considerations and Strategy.J Pharm Sci. 2015 Jun;104(6):1899-1908. doi: 10.1002/jps.24437. Epub 2015 Apr 1. J Pharm Sci. 2015. PMID: 25832583 Review.
-
Polymeric nanoparticles and microparticles for the delivery of peptides, biologics, and soluble therapeutics.J Control Release. 2015 Dec 10;219:519-535. doi: 10.1016/j.jconrel.2015.09.001. Epub 2015 Sep 8. J Control Release. 2015. PMID: 26359125 Review.
Cited by
-
Sustained Drug Release from Smart Nanoparticles in Cancer Therapy: A Comprehensive Review.Micromachines (Basel). 2022 Sep 28;13(10):1623. doi: 10.3390/mi13101623. Micromachines (Basel). 2022. PMID: 36295976 Free PMC article. Review.
-
Evaluation of in vitro Assays to Assess the Modulation of Dendritic Cells Functions by Therapeutic Antibodies and Aggregates.Front Immunol. 2019 Mar 28;10:601. doi: 10.3389/fimmu.2019.00601. eCollection 2019. Front Immunol. 2019. PMID: 31001248 Free PMC article.
-
Enhanced Skin Delivery of Therapeutic Peptides Using Spicule-Based Topical Delivery Systems.Pharmaceutics. 2021 Dec 8;13(12):2119. doi: 10.3390/pharmaceutics13122119. Pharmaceutics. 2021. PMID: 34959402 Free PMC article.
-
Investigation into the Acceptability of Moderate-to-Large Volume Subcutaneous Injections in Healthy Volunteers: Results from a Single-Center Randomized Controlled Study.Med Devices (Auckl). 2024 Oct 25;17:369-384. doi: 10.2147/MDER.S479507. eCollection 2024. Med Devices (Auckl). 2024. PMID: 39479340 Free PMC article.
-
Strategies to prevent drug incompatibility during simultaneous multi-drug infusion in intensive care units: a literature review.Eur J Clin Pharmacol. 2021 Sep;77(9):1309-1321. doi: 10.1007/s00228-021-03112-1. Epub 2021 Mar 25. Eur J Clin Pharmacol. 2021. PMID: 33768303 Review.
References
-
-
Online package inserts for individual drug.
-
-
- Yalkowsky SHKJF, Ward GH. Formulation-Related Problems Associated with Intravenous Drug Delivery. Journal of Pharmaceutical Sciences. 1998;87(7):787–796. - PubMed
-
- Turco SJ. Sterile Dosage Forms- their preparation and clinical application, 4 ed. Lea and Febiger. 1994:28–38.
-
- Berger M. Adverse effects of IgG therapy. Journal of Allergy and Clinical Immunology: In Practice. 2013;1(6):558–566. - PubMed
-
- Bichuetti-Silva DC, Furlan FP, Nobre FA, Pereira CTM, Gonçalves TRT, Gouveia-Pereira M, Rota R, Tavares L, Mazzucchelli JTL, Costa-Carvalho BT. Immediate infusion-related adverse reactions to intravenous immunoglobulin in a prospective cohort of 1765 infusions. International Immunopharmacology. 2014;23(2):442–446. - PubMed
Publication types
MeSH terms
Substances
Grants and funding
LinkOut - more resources
Full Text Sources
Other Literature Sources
