

Review
doi: 10.1016/S0140-6736(16)31599-9.
Epub 2016 Nov 8.
Essential medicines for universal health coverage
Affiliations
- PMID: 27832874
- PMCID: PMC7159295
- DOI: 10.1016/S0140-6736(16)31599-9
Item in Clipboard
Review
Essential medicines for universal health coverage
Lancet.
.
No abstract available
Figures
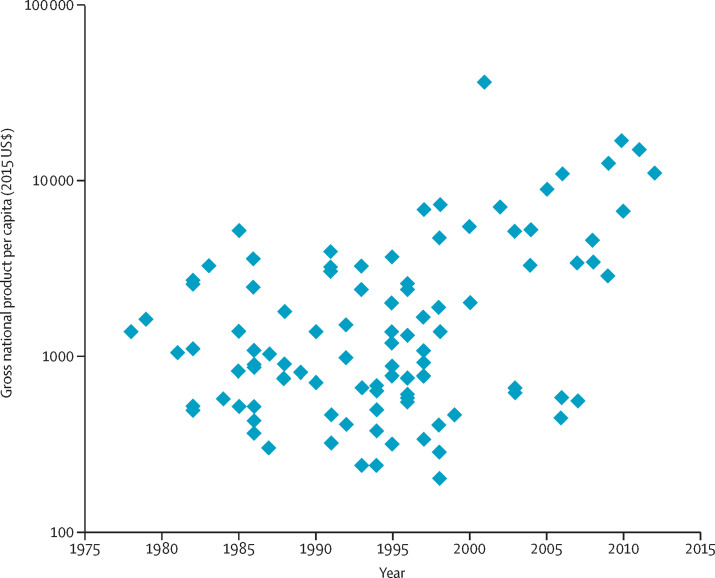
GDP per capita in the year of a country's first national list of essential medicines A systematic search of national essential medicines lists was done using the following data repositories: the Documentation Centre of the WHO Department of Essential Medicines and Health Products in Geneva; WHO National Pharmaceutical Profiles of 1997, 2003, 2007, and 2011; literature searches, searches using Google and websites of essential medicine programmes; and a specific call through the E-DRUG listserv. In case of contradictory information, especially with regard to date of publication, the original document was identified and studied when possible. The dataset includes 101 countries for which at least one national essential medicines list could be identified. Excluded were institutional, regional, and national reimbursement lists. For each country, the year of the first national essential medicines list and the GDP per capita in that year, according to the World Bank, were identified. This figure shows the national GDP (expressed in 2015 US$) in the year of publication of the first national essential medicines list. Every dot represents one country with a first national essential medicines list. GDP=gross domestic product.
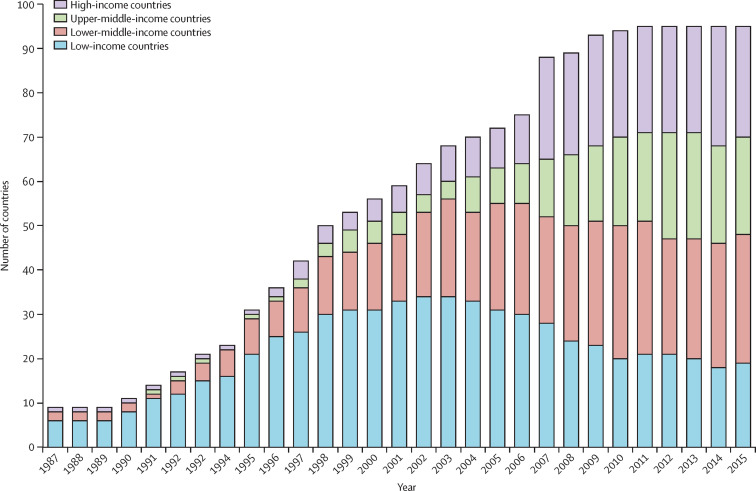
Number of countries with a first NMP in different economic categories per year A systematic search of all national medicines policies published was done using the following data repositories: the Documentation Centre of the WHO Department of Essential Medicines and Health Products in Geneva; information from the WHO National Pharmaceutical Profiles of 1997, 2003, 2007, and 2011; literature searches, searches using Google and websites of essential medicine programmes; and a specific call through the E-DRUG listserv. In case of contradictory information, especially with regard to status or date of publication, the original document was identified and studied when possible. The dataset includes 95 countries for which at least one official NMP could be identified. Excluded were draft medicine policy documents and policy documents with unclear status. For each country, the year of the first official NMP and the level of economic development (low, lower-middle, upper-middle, and high) according to the World Bank classification in each year, were identified. While the total number of countries with a first NMP increases over time, the number of countries within an economic category can decrease when a country moves to another category. NMP=national medicine policy.
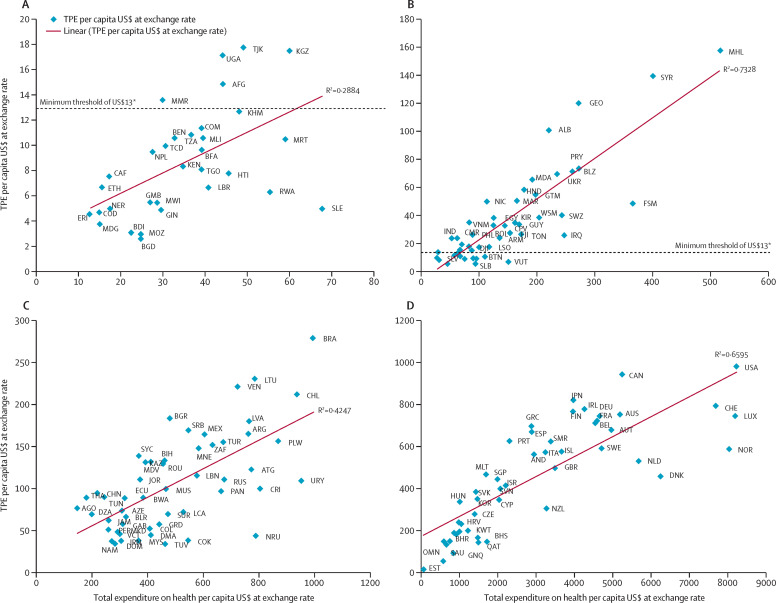
Relationship between per capita pharmaceutical expenditure and per capita health expenditure in 2010 Countries are indicated with the ISO Alpha-3 code .*Minimum threshold based on costing model (see section 1). Low-income countries (A). Lower-middle-income countries. †Countries at or below the threshold were: BTN, LAO, GHA, SLV, PNG, STP, SEN, SLB, SDN, TLS, VUT, ZMB (B). Upper-middle-income countries (C). High-income countries (D). TPE=total pharmaceutical expenditure. BTN=Bhutan. LAO=Laos. GHA=Ghana. SLV=El Salvador. PNG=Papua New Guinea. STP=São Tomé and Príncipe. SEN=Senegal. SLB=Solomon Islands. SDN=Sudan. TLS=Timor-Leste. VUT=Vanuatu. ZMB=Zambia. AFG=Afghanistan. AGO=Angola. ALB=Albania. AND=Andorra. ARE=United Arab Emirates. ARG=Argentina. ARM=Armenia. ATG=Antigua and Barbuda. AUS=Australia. AUT=Austria. AZE=Azerbaijan. BDI=Burundi. BEL=Belgium. BEN=Benin. BFA=Burkina Faso. BGD=Bangladesh. BGR=Bulgaria. BHR=Bahrain. BHS=The Bahamas. BIH=Bosnia and Herzegovina. BLR=Belarus. BLZ=Belize. BRA=Brazil. BRB=Barbados. BRN=Brunei. BWA=Botswana. CAF=Central African Republic. CAN=Canada. CHE=Switzerland. CHL=Chile. CHN=China. CMR=Cameroon. COD=Democratic Republic of the Congo. COK=Cook Islands. COL=Colombia. COM=Comoros. CPV=Cape Verde. CRI=Costa Rica. CYP=Cyprus. CZE=Czech Republic. DEU=Germany. DJI=Djibouti. DMA=Dominica. DNK=Denmark. DOM=Dominican Republic. DZA=Algeria. ECU=Ecuador. EGY=Egypt. ERI=Eritrea. ESP=Spain. EST=Estonia. ETH=Ethiopia. FIN=Finland. FJI=Fiji. FRA=France. FSM=Federated States of Micronesia. GAB=Gabon. GBR=Great Britain and Northern Ireland. GEO=Georgia. GIN=Guinea. GMB=The Gambia. GNQ=Equatorial Guinea. GRC=Greece. GRD=Grenada. GTM=Guatemala. GUY=Guyana. HND=Honduras. HRV=Croatia. HTI=Haiti. HUN=Hungary. IND=India. IRL=Ireland. IRQ=Iraq. IRN=Iran. ISL=Iceland. ISR=Israel. ITA=Italy. JAM=Jamaica. JOR=Jordan. JPN=Japan. KAZ=Kazakhstan. KEN=Kenya. KGZ=Kyrgyzstan. KHM=Cambodia. KIR=Kiribati. KNA=Saint Kitts and Nevis. KOR=South Korea. KWT=Kuwait. LBR=Liberia. LBN=Lebanon. LCA=Saint Lucia. LSO=Lesotho. LTU=Lithuania. LUX=Luxembourg. LVA=Latvia. MAR=Morocco. MDA=Moldova. MDG=Madagascar. MDV=Maldives. MEX=Mexico. MHL=Marshall Islands. MKD=Macedonia. MLI=Mali. MLT=Malta. MMR=Myanmar. MNE=Montenegro. MOZ=Mozambique. MRT=Mauritania. MWI=Malawi. MUS= Mauritius. MYS=Malaysia. NAM=Namibia. NER=Niger. NIC=Nicaragua. NLD=Netherlands. NOR=Norway. NPL=Nepal. NRU=Nauru. NZL=New Zealand. OMN=Oman. PAN=Panama. PER=Peru. PHL=Philippines. PLW=Palau. POL=Poland. PRT=Portugal. PRY=Paraguay. QAT=Qatar. ROU=Romania. RUS=Russian. RWA=Rwanda. SAU=Saudi Arabia. SGP=Singapore. SLE=Sierra Leone. SMR=San Marino. SRB=Serbia. SUR=Suriname. SVK=Slovakia. SVN=Slovenia. SWE=Sweden. SWZ=Swaziland. SYC=Seychelles. SYR=Syria. TCD=Chad. TGO=Togo. THA=Thailand. TJK=Tajikistan. TON=Tonga. TTO=Trinidad and Tobago. TUN=Tunisia. TUR=Turkey. TUV=Tuvalu. TZA=Tanzania. UGA=Uganda. UKR=Ukraine. URY=Uruguay. USA=United States of America. VCT=Saint Vincent and the Grenadines. VEN=Venezuela. VNM=Vietnam. WSM=Samoa. ZAF=South Africa.
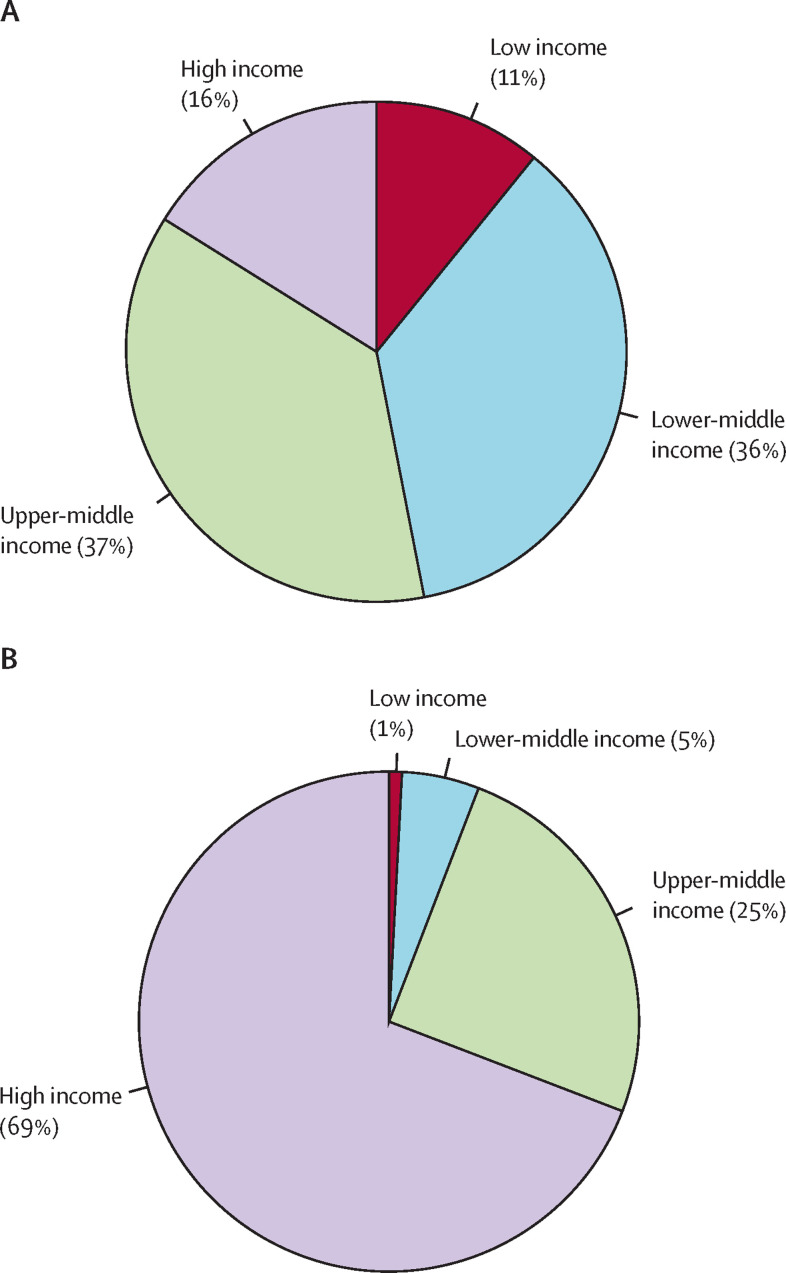
Distribution of world population (A) and total pharmaceutical expenditure (B) in different economic categories in 2010
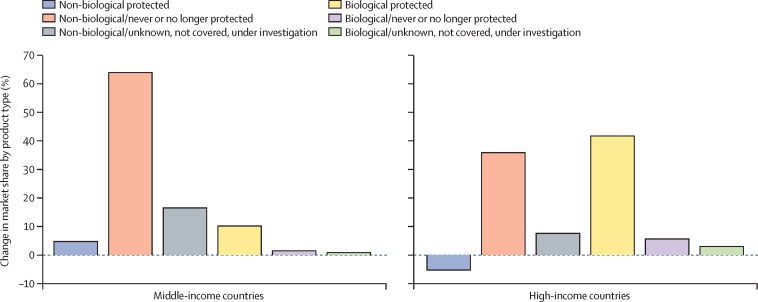
Percentage contribution to change in market share by type of product in middle-income and high-income countries in 2005–15 This figure is a new elaboration of IMS Health data (for more information on the classification and countries included see appendix 2.3).
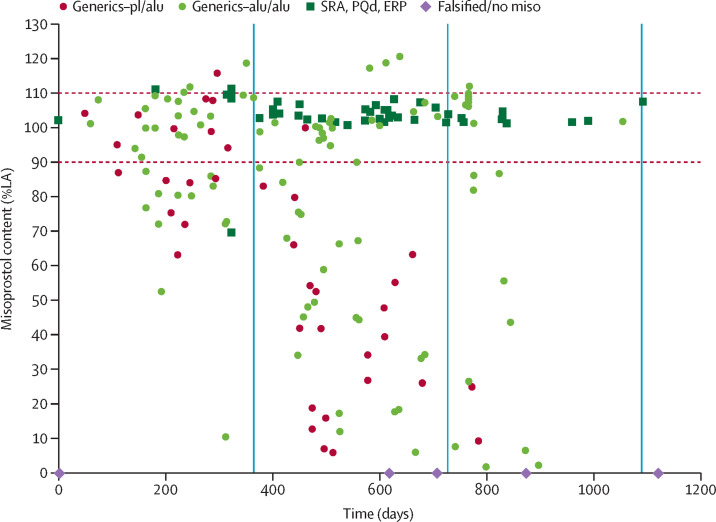
Quality of misoprostol tablets in 15 low-income and middle-income countries Figure was adapted from Hall and Tagontong. A date of production could not be established for two samples. Those samples were each assigned zero days. LA=labelled amount. pl/alu=blister packaging consisting of a plastic and an aluminium component. alu/alu=blister packaging consisting of all aluminium components. SRA=stringent regulatory authority. ERP=Global Fund Expert Review Panel. PQd=WHO Prequalification Programme. Falsified/no miso=falsified product that contained no misoprostol.
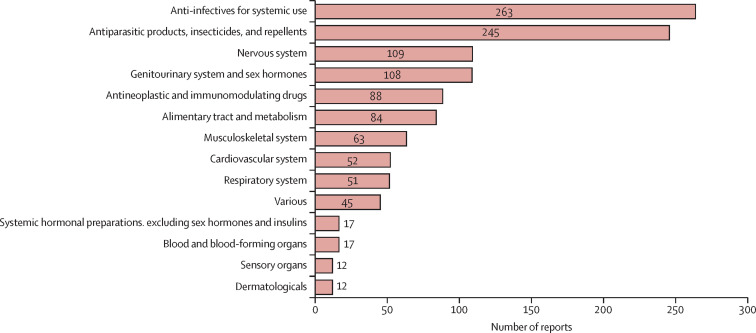
Reports of substandard/spurious/falsely-labelled/falsified/counterfeit medical products to WHO Rapid Alert database Total reports=1166. Data from WHO Global Rapid Alert System, between July, 2013, and August, 2016.
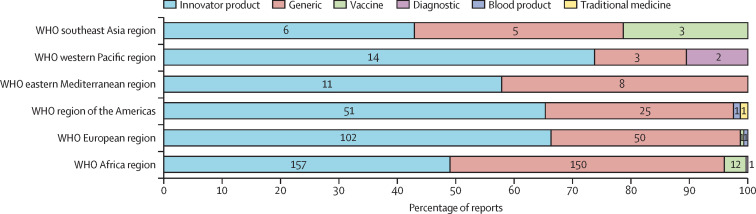
Confirmed falsified products reported from the six WHO regions The numbers on the bars represent the number of reports of confirmed falsified products received between July, 2013, and August, 2016. Total reports=604. Data from WHO Global Rapid Alert System.
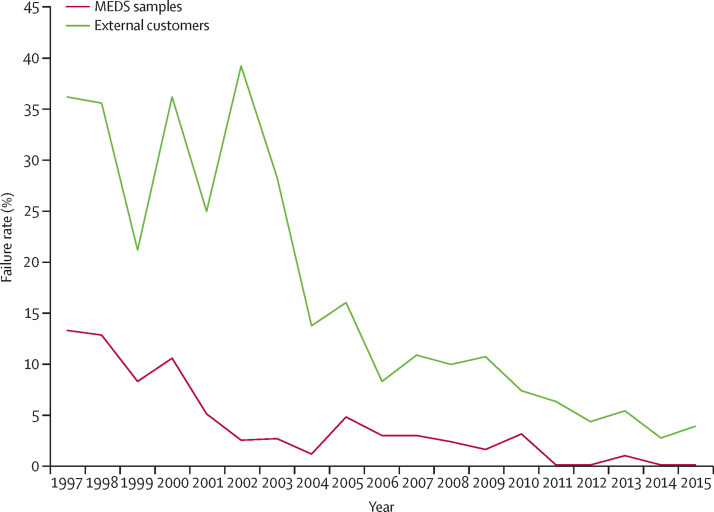
Percentage of quality failures reported by MEDS, Nairobi (1997–2015) Data from MEDS . Figure adapted from MEDS, Nairobi, Kenya, 2015, with permission. The red line in the graph presents the reduction in quality failures of medicines procured by MEDS, showing that a well published and enforced quality assurance programme can lead to better quality products. The green line presents the quality results in external samples, which were submitted to the MEDS laboratory for testing, where a similar trend is visible. A failure rate below 3–5% of samples tested indicates a well functioning quality assurance system. MEDS=Mission for Essential Medicines and Supplies.
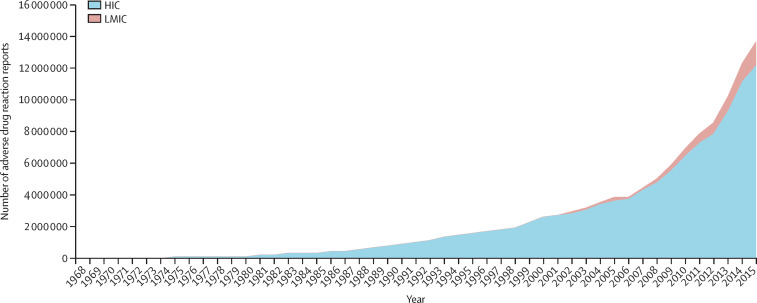
Number of adverse drug reaction reports in HIC and LMIC Data from Uppsala Monitoring Centre . HIC=high-income countries. LMIC=low-income and middle-income countries.
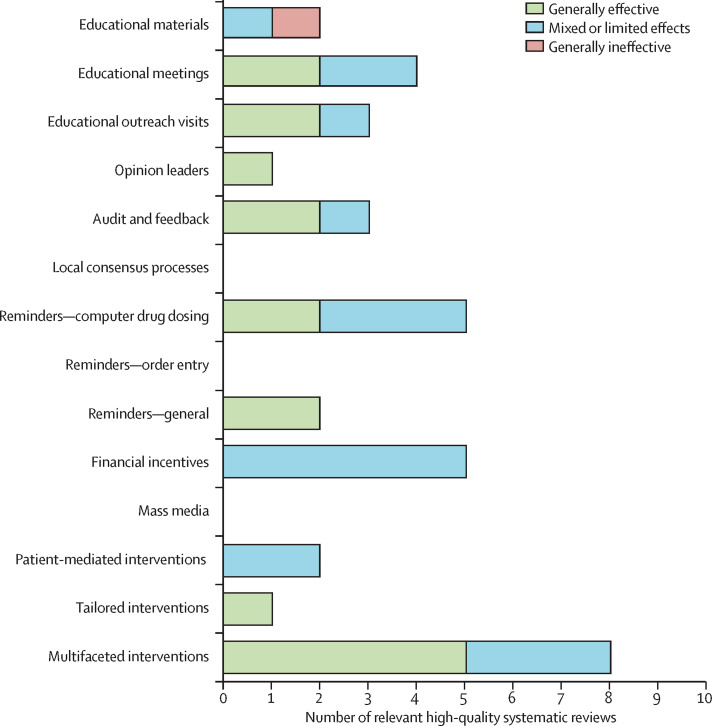
Evidence from high-quality systematic reviews about effectiveness interventions targeting use of medicines by health professionals
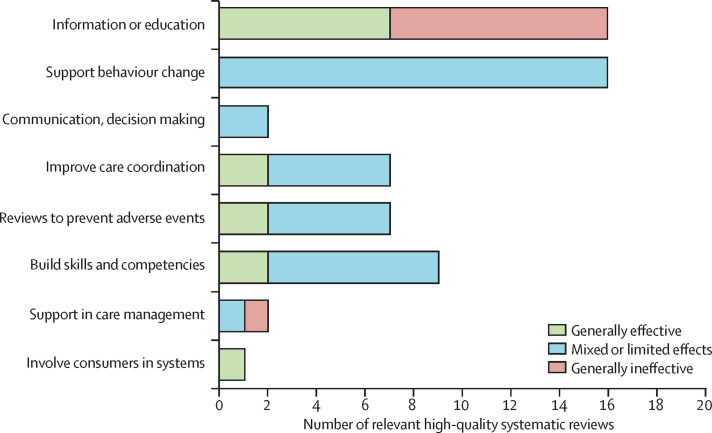
Evidence from high-quality systematic reviews about effectiveness of different types of interventions targeting patients and consumers
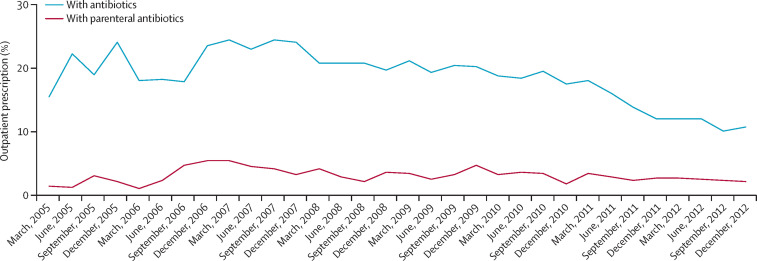
Total and parenteral outpatient antibiotic use in tertiary hospitals in China (2005–12) Data adapted with permission from Sun and colleagues. The comprehensive antibiotic stewardship programme in hospitals targeted outpatient antibiotic prescribing rates of <20% of patients and inpatient antibiotic prescribing rates of <60% of patients; antibiotic prophylaxis to be given before incision and not continued for more than 24 h; and total inpatient antibiotic consumption <400 defined daily doses per 1000 inpatient days. By December, 2012, antibiotic consumption had dropped to half of its highest level and use of parenteral antibiotics in outpatients had begun to decline.
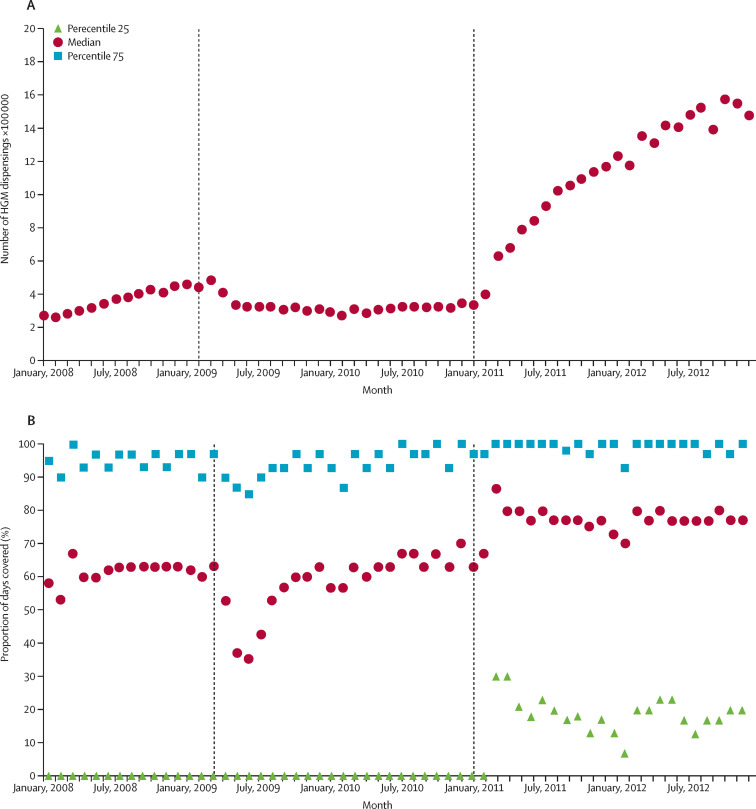
Farmacia Popular participation and proportion of days covered This data is after policies first increased patient cost sharing and then made medicines available for free to patients. In 2011, essential medicines for hypertension, diabetes, and asthma began to be provided in both public and private pharmacies with zero copayment from patients. This change led to a dramatic rise in participation in the programme by patients with diabetes, from 400 000 to more than 1·4 million prescriptions filled per month. Proportion of days covered (a measure of adherence) increased to about 80%, which is considered close to the optimum value for chronic illness care. Participation in Farmacia Popular (A). Proportion of days covered (B).
Comment in
-
Essential medicines for universal health coverage.Lancet. 2017 Jan 28;389(10067):337-339. doi: 10.1016/S0140-6736(16)31907-9. Epub 2016 Nov 8. Lancet. 2017. PMID: 27832878 No abstract available.
-
Veronika Wirtz: global leader in improving access to medicines.Lancet. 2017 Jan 28;389(10067):357. doi: 10.1016/S0140-6736(16)32137-7. Epub 2016 Nov 8. Lancet. 2017. PMID: 27836190 No abstract available.
-
Essential medicines for universal health coverage.Lancet. 2017 May 13;389(10082):1880-1881. doi: 10.1016/S0140-6736(17)31211-4. Epub 2017 May 11. Lancet. 2017. PMID: 28513444 No abstract available.
References
-
- UN Sustainable development goals. 2015. https://sustainabledevelopment.un.org/sdgs (accessed March 4, 2016).
-
- WHO What is universal health coverage? http://www.who.int/universal_health_coverage/en/index.html (accessed April 9, 2016).
-
- Wagner AK, Graves AJ, Reiss SK, Lecates R, Zhang F, Ross-Degnan D. Access to care and medicines, burden of health care expenditures, and risk protection: results from the World Health Survey. Health Policy. 2011;100:151–158. - PubMed
Publication types
MeSH terms
Substances
Grants and funding
LinkOut - more resources
Full Text Sources
Other Literature Sources
