. 2016 Nov 9:9:50.
doi: 10.1186/s13072-016-0102-4. eCollection 2016.

Identification of activated enhancers and linked transcription factors in breast, prostate, and kidney tumors by tracing enhancer networks using epigenetic traits

Affiliations

Identification of activated enhancers and linked transcription factors in breast, prostate, and kidney tumors by tracing enhancer networks using epigenetic traits

Suhn Kyong Rhie et al. Epigenetics Chromatin. .

Abstract

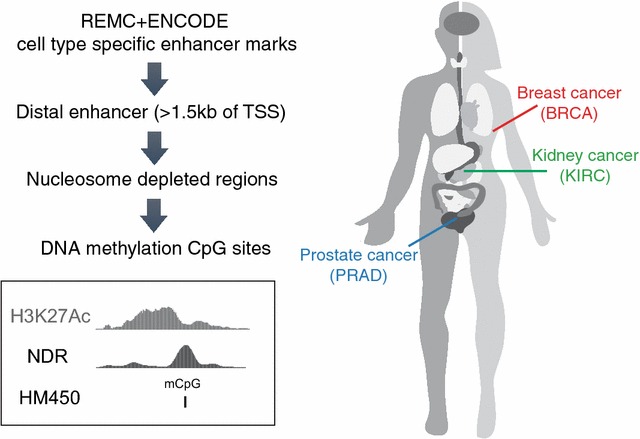
Background: Although technological advances now allow increased tumor profiling, a detailed understanding of the mechanisms leading to the development of different cancers remains elusive. Our approach toward understanding the molecular events that lead to cancer is to characterize changes in transcriptional regulatory networks between normal and tumor tissue. Because enhancer activity is thought to be critical in regulating cell fate decisions, we have focused our studies on distal regulatory elements and transcription factors that bind to these elements.

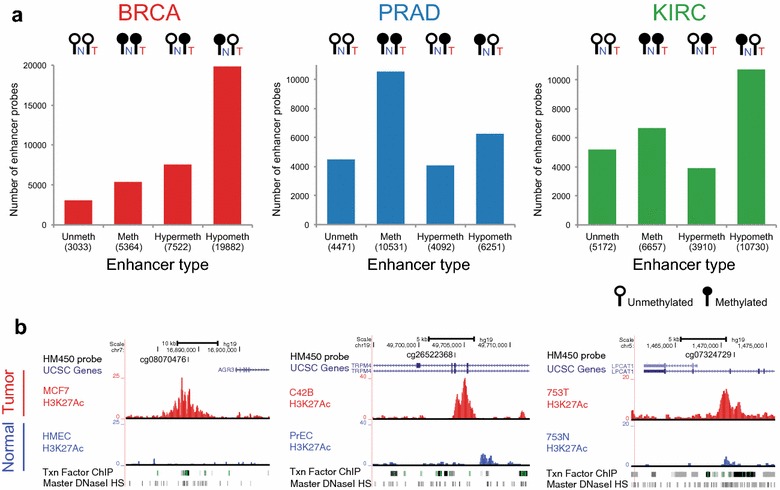
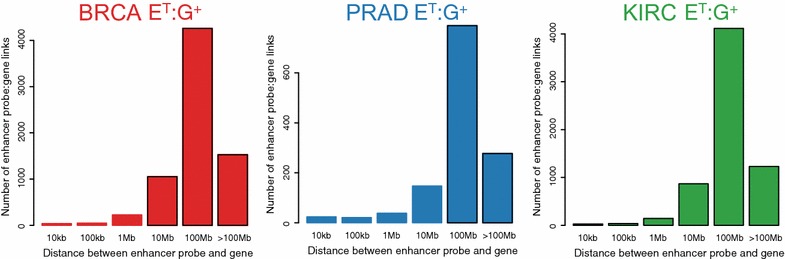
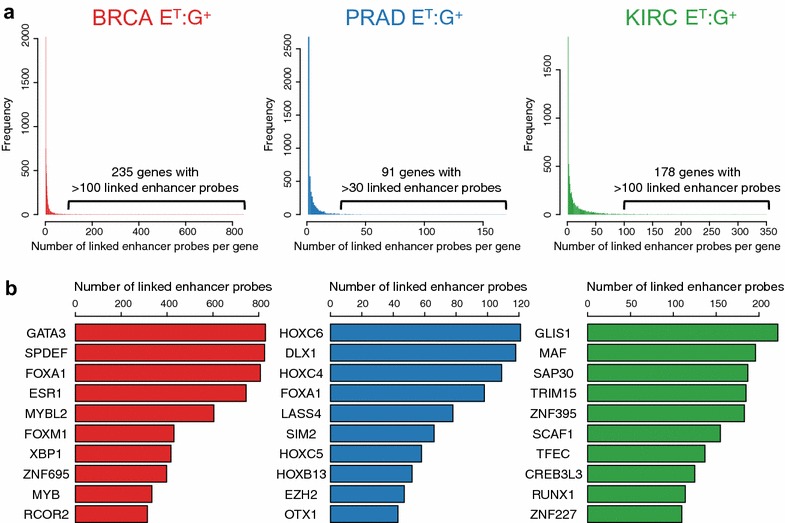
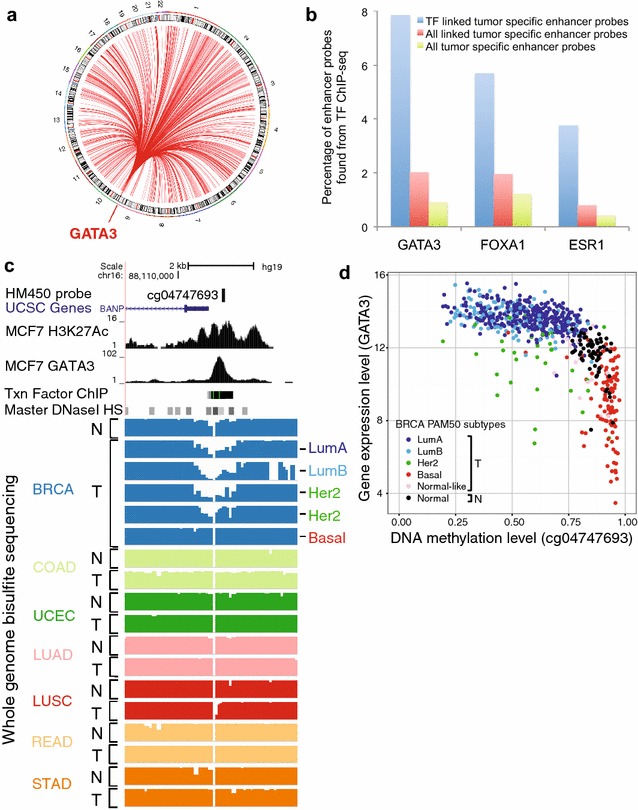
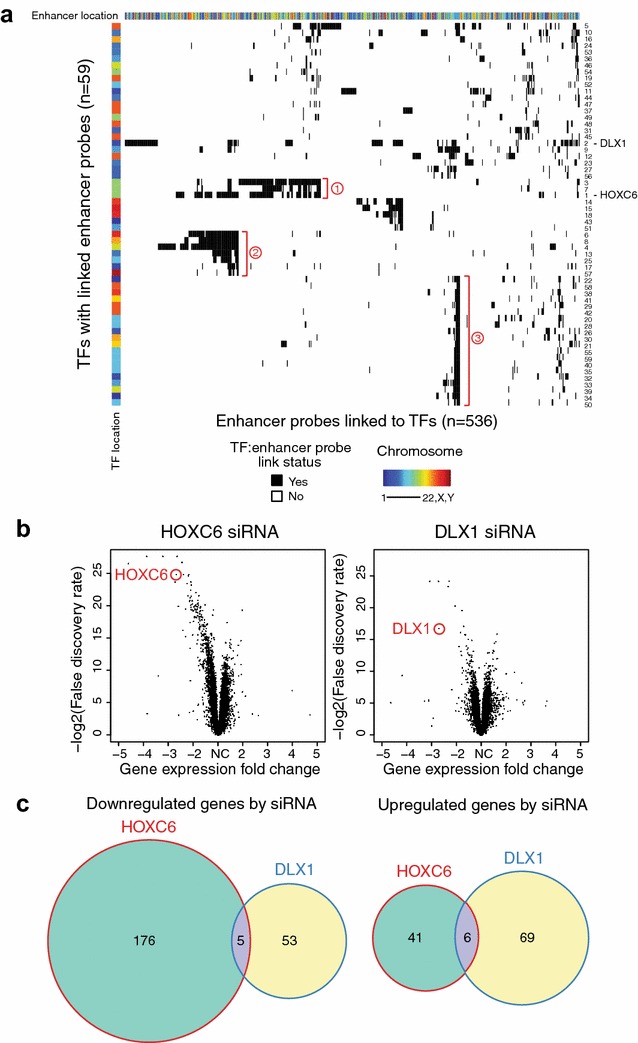
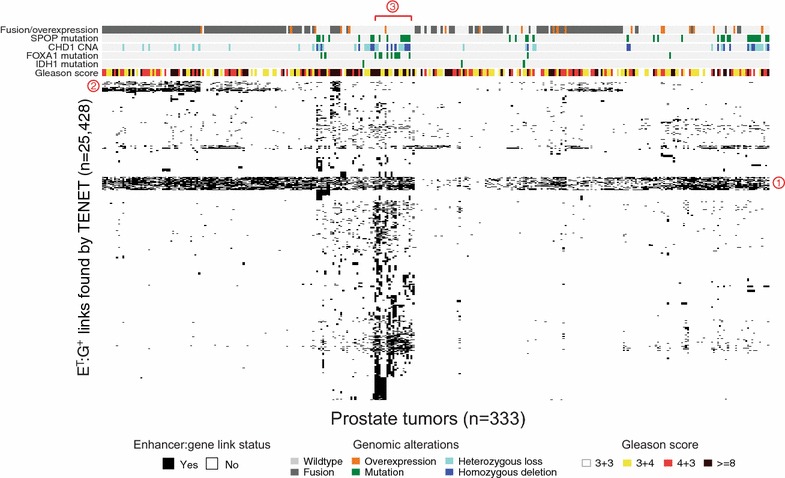
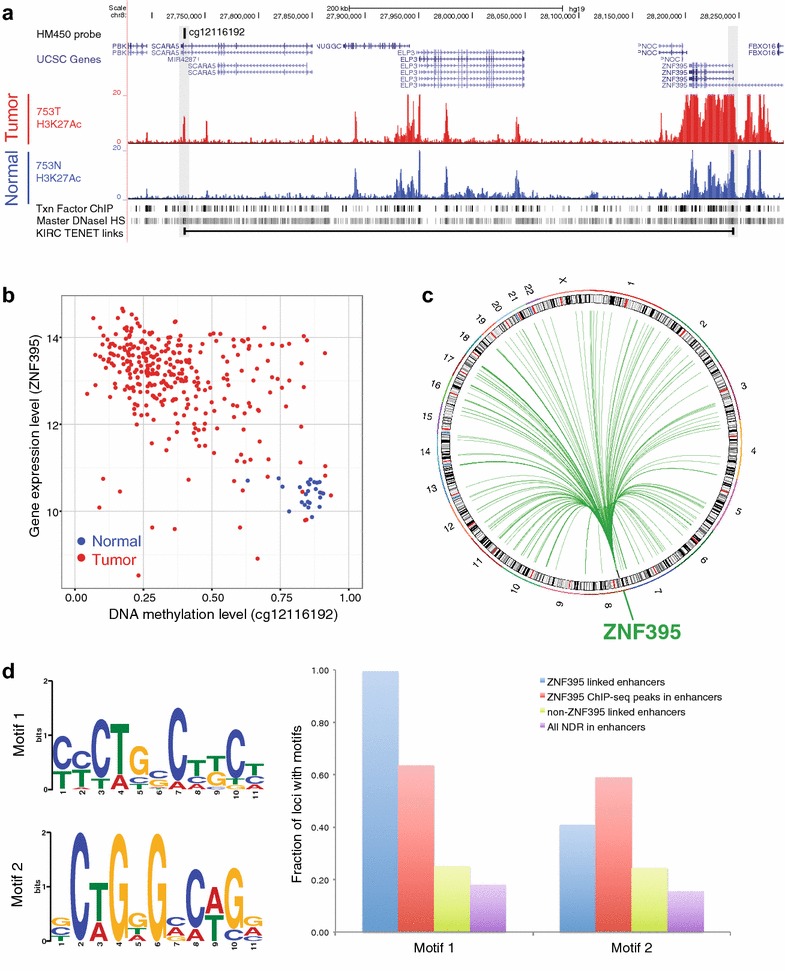
Results: Using DNA methylation data, we identified more than 25,000 enhancers that are differentially activated in breast, prostate, and kidney tumor tissues, as compared to normal tissues. We then developed an analytical approach called Tracing Enhancer Networks using Epigenetic Traits that correlates DNA methylation levels at enhancers with gene expression to identify more than 800,000 genome-wide links from enhancers to genes and from genes to enhancers. We found more than 1200 transcription factors to be involved in these tumor-specific enhancer networks. We further characterized several transcription factors linked to a large number of enhancers in each tumor type, including GATA3 in non-basal breast tumors, HOXC6 and DLX1 in prostate tumors, and ZNF395 in kidney tumors. We showed that HOXC6 and DLX1 are associated with different clusters of prostate tumor-specific enhancers and confer distinct transcriptomic changes upon knockdown in C42B prostate cancer cells. We also discovered de novo motifs enriched in enhancers linked to ZNF395 in kidney tumors.

Conclusions: Our studies characterized tumor-specific enhancers and revealed key transcription factors involved in enhancer networks for specific tumor types and subgroups. Our findings, which include a large set of identified enhancers and transcription factors linked to those enhancers in breast, prostate, and kidney cancers, will facilitate understanding of enhancer networks and mechanisms leading to the development of these cancers.

Keywords: DNA methylation; Enhancer; Epigenetics; Networks; Transcription factor.


Figures

Fig. 1
Fig. 1
Study design. To define genomic regions for analysis of enhancer activity in tumor samples, we used the genomic coordinates of enhancers identified by REMC and ENCODE for 98 tissues or cell lines, plus genomic coordinates of additional H3K27Ac ChIP-seq peaks from several cancer cell lines and normal cells for breast, prostate, and kidney. We then selected the subset of these regulatory elements that are located >1.5 kb from a known transcription state site (TSS), as defined using GENCODE v19. We further narrowed the regions by intersecting with the set of ENCODE Master DNaseI-seq peaks from 125 tissues or cell lines or DNaseI-seq, FAIRE-seq, or NOMe-seq peaks of corresponding cell types (Additional file 2: Table S1). The HM450 array probes that overlapped the narrowed enhancer regions were then used to study enhancer activity in normal and tumor tissues
Fig. 2
Fig. 2
Identification of differentially methylated enhancer regions. a Differentially methylated enhancer probes located in epigenetically defined enhancers were identified by using DNA methylation profiles from TCGA for breast (BRCA), prostate (PRAD), and kidney (KIRC) tumor tissues. Unmeth: enhancer probes unmethylated in both normal and tumor samples; Meth: enhancer probes methylated in both normal and tumor samples; Hypermeth: enhancer probes unmethylated in normals, but methylated in tumors; Hypometh: enhancer probes methylated in normals, but unmethylated in tumors; the number of enhancer probes for each category is shown in parentheses. b Examples of hypomethylated enhancers (i.e., tumor-specific enhancers) are shown for BRCA (center), PRAD (left), and KIRC (right). Genome browser screen shots show genomic coordinates, HM450 probe location, UCSC genes, H3K27Ac ChIP-seq tracks in tumor (MCF7, C42B, and 753T) and normal (HMEC, PrEC, and 753N) cells, the ENCODE layered ChIP-seq track for 161 TFs, and the ENCODE Master DNaseI hypersensitive site track for 125 cell types
Fig. 3
Fig. 3
Distribution of enhancer probe:gene links on the same chromosome. Shown is the number of enhancer probe to gene links (ET:G+) on the same chromosome by distance in BRCA (left, red), PRAD (center, blue), and KIRC (right, green)
Fig. 4
Fig. 4
Identification of TFs associated with the activity of many enhancers. a Shown is the number of linked enhancer probes per gene in the ET:G+ category for BRCA (left), PRAD (center), and KIRC (right). b The top 10 TFs identified to be linked to a large number of enhancer probes for BRCA (left), PRAD (center), and KIRC (right)
Fig. 5
Fig. 5
GATA3 is linked to many enhancers in breast tumor tissues. a Shown is a circos plot of the enhancers having an active state positively linked to expression of GATA3. b Percentage of all tumor-specific enhancers (green), all tumor-specific enhancers linked to genes (red), and tumor-specific enhancers linked to GATA3, FOXA1, or ESR1 (blue) expression that overlap with TF ChIP-seq for GATA3, FOXA1, or ESR1. c Genome browser screen shots of an enhancer (containing probe cg04747693) having an active state in breast tumors, that is positively linked to expression of GATA3; the probe is located within a H3K27Ac and a GATA3 peak in MCF7 cells and in a hypomethylated region specifically found in non-basal breast cancer cells. d Shown is a scatterplot of the DNA methylation of the enhancer probe and GATA3 expression in normal and different subtypes of breast tumor tissues
Fig. 6
Fig. 6
TFs linked to many tumor-specific enhancers in prostate tissues. a Unsupervised clustering of the enhancer probe:TF sets for PRAD for which a TF is associated with more than 10 hypomethylated (tumor-specific) enhancer probes. The rows indicate the 59 TFs, and the columns indicate the 536 hypomethylated enhancer probes linked to TFs; when there is a link, the cell is colored in black. On the top of the heatmap is shown the chromosomal location for each enhancer probe. On the left side of the heatmap is shown the chromosomal location for each TF. TF number on the right side indicates the TF rank, as determined by the number of linked enhancer probes for each TF (Additional file 6: Table S5). Three clusters of TFs that are linked to the same enhancers are marked by brackets with circled numbers. b Volcano plots identifying genes differentially expressed upon knockdown of HOXC6 and DLX1; triplicate control and knockdown samples were analyzed. c Venn diagrams of significantly down- or upregulated genes upon knockdown of HOXC6 and DLX1
Fig. 7
Fig. 7
Heatmap of enhancer:gene links in prostate tumor tissues. Unsupervised clustering results using the ET:G+ links (n = 25,428) for prostate tumors (n = 333) with previously defined genomic alternations commonly found in prostate tumors and Gleason scores of the tumors [14]. Three clusters of ET:G+ links are marked by red-circled numbers
Fig. 8
Fig. 8
ZNF395-linked enhancers in kidney tumor tissues. a Genome browser screen shots near the tumor-specific enhancer probe cg12116192. From top, shown are the genomic coordinates, HM450 probe location, UCSC genes, H3K27Ac ChIP-seq tracks in tumor (753T) and normal (753N) cells, the ENCODE layered TF ChIP-seq track, the ENCODE Master DNaseI hypersensitive site track, and an intra-chromosomal TENET-identified link between the enhancer probe cg12116192 and the ZNF395 gene; left shaded region is the enhancer probe cg12116192, and the right shaded region is the transcription start site of ZNF395. b Scatterplot of the DNA methylation level of the enhancer probe cg12116192 and ZNF395 expression in normal and tumor kidney tissues. c Circos plot of the 183 enhancers having an active state positively linked to expression of the ZNF395 gene in KIRC. d Logos of two de novo motifs identified in the 183 enhancers linked to ZNF395 expression are shown on the left; fraction of regions with the two motifs in the 183 ZNF395-linked enhancers, in 7767 enhancers identified using a GFP antibody in K562 cells expressing a GFP-tagged ZNF395, in all linked enhancers identified in KIRC except those linked to ZNF395, and in all distal NDR regions used in this study

References

    1. Yao L, Shen H, Laird PW, Farnham PJ, Berman BP. Inferring regulatory element landscapes and transcription factor networks from cancer methylomes. Genome Biol. 2015;16:105. doi: 10.1186/s13059-015-0668-3. - DOI - PMC - PubMed
    1. Ernst J, Kheradpour P, Mikkelsen TS, Shoresh N, Ward LD, Epstein CB, Zhang X, Wang L, Issner R, Coyne M, et al. Mapping and analysis of chromatin state dynamics in nine human cell types. Nature. 2011;473(7345):43–49. doi: 10.1038/nature09906. - DOI - PMC - PubMed
    1. Rada-Iglesias A, Bajpai R, Swigut T, Brugmann SA, Flynn RA, Wysocka J. A unique chromatin signature uncovers early developmental enhancers in humans. Nature. 2011;470(7333):279–283. doi: 10.1038/nature09692. - DOI - PMC - PubMed
    1. Aran D, Sabato S, Hellman A. DNA methylation of distal regulatory sites characterizes dysregulation of cancer genes. Genome Biol. 2013;14(3):R21. doi: 10.1186/gb-2013-14-3-r21. - DOI - PMC - PubMed
    1. Rhie SK, Hazelett DJ, Coetzee SG, Yan C, Noushmehr H, Coetzee GA. Nucleosome positioning and histone modifications define relationships between regulatory elements and nearby gene expression in breast epithelial cells. BMC Genom. 2014;15:331. doi: 10.1186/1471-2164-15-331. - DOI - PMC - PubMed

Publication types

MeSH terms