. 2016 Nov 9;17(11):1867.
doi: 10.3390/ijms17111867.

Tonsil-Derived Mesenchymal Stem Cells Differentiate into a Schwann Cell Phenotype and Promote Peripheral Nerve Regeneration

Affiliations

Tonsil-Derived Mesenchymal Stem Cells Differentiate into a Schwann Cell Phenotype and Promote Peripheral Nerve Regeneration

Namhee Jung et al. Int J Mol Sci. .

Abstract

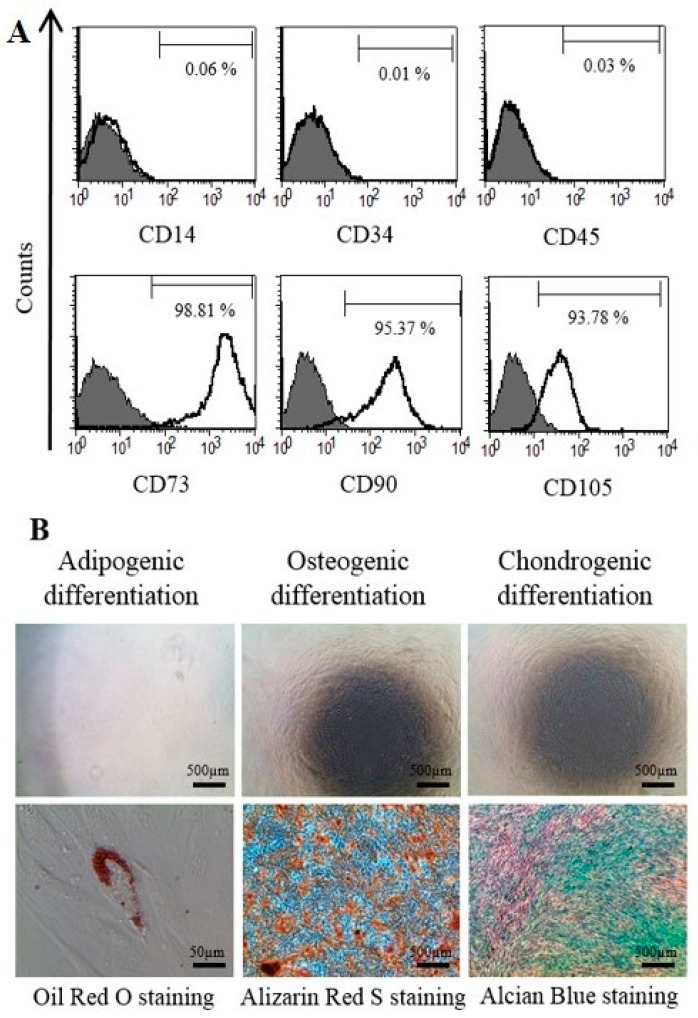
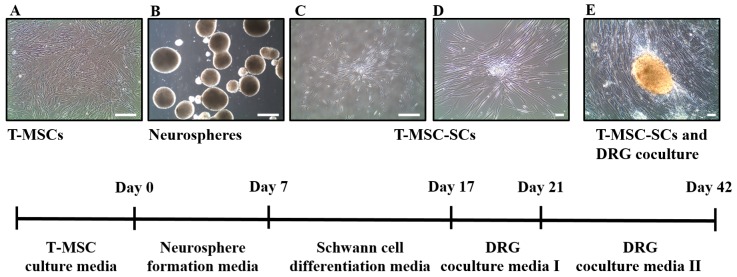
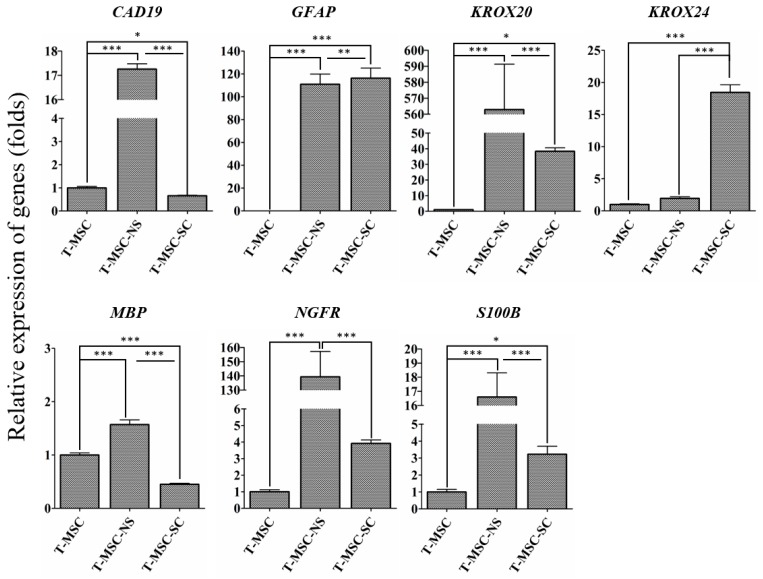
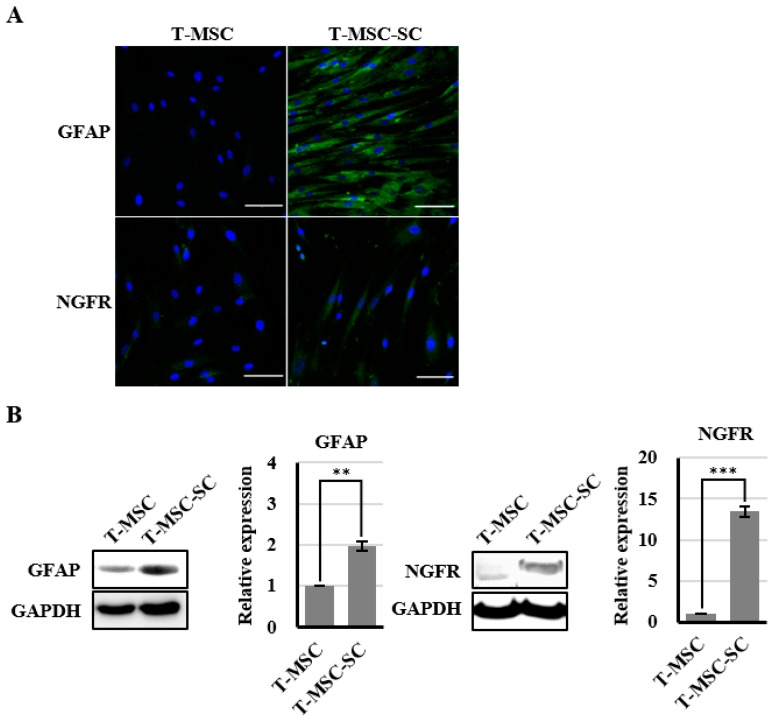
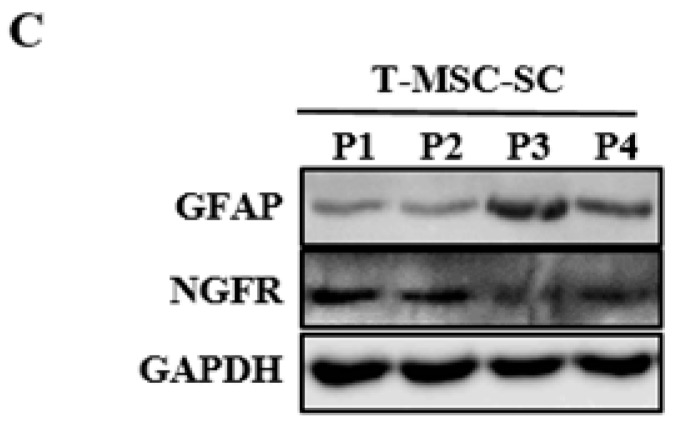
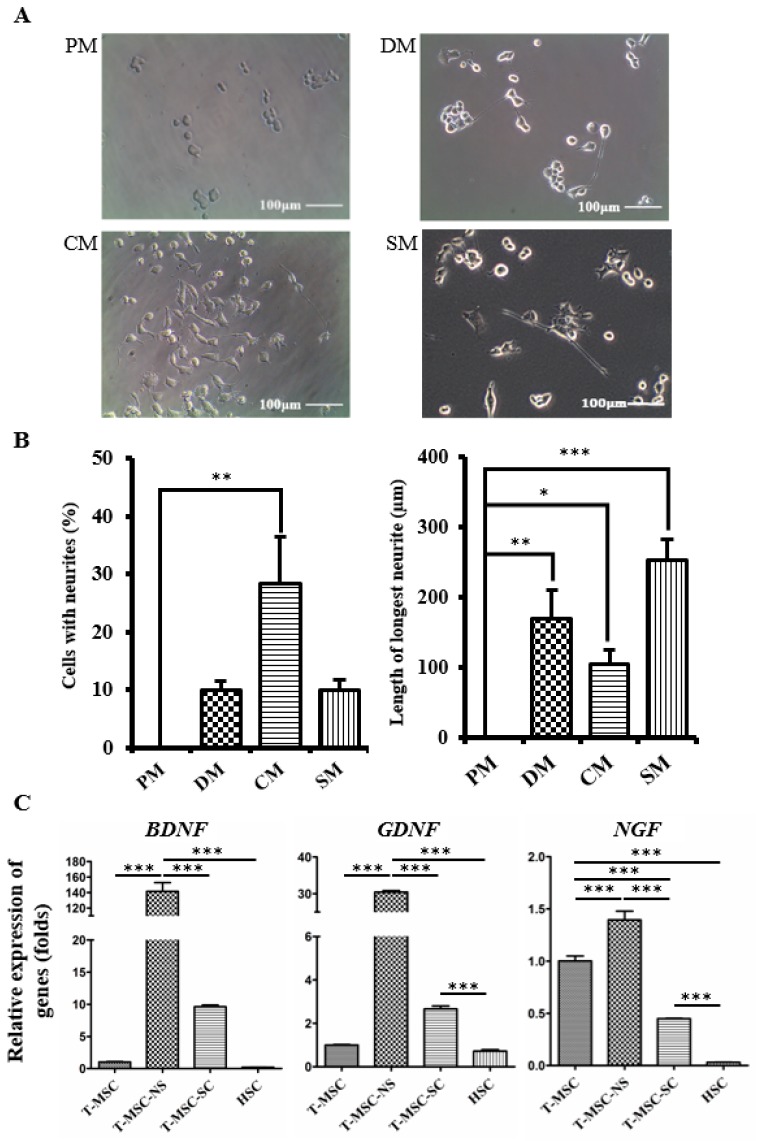
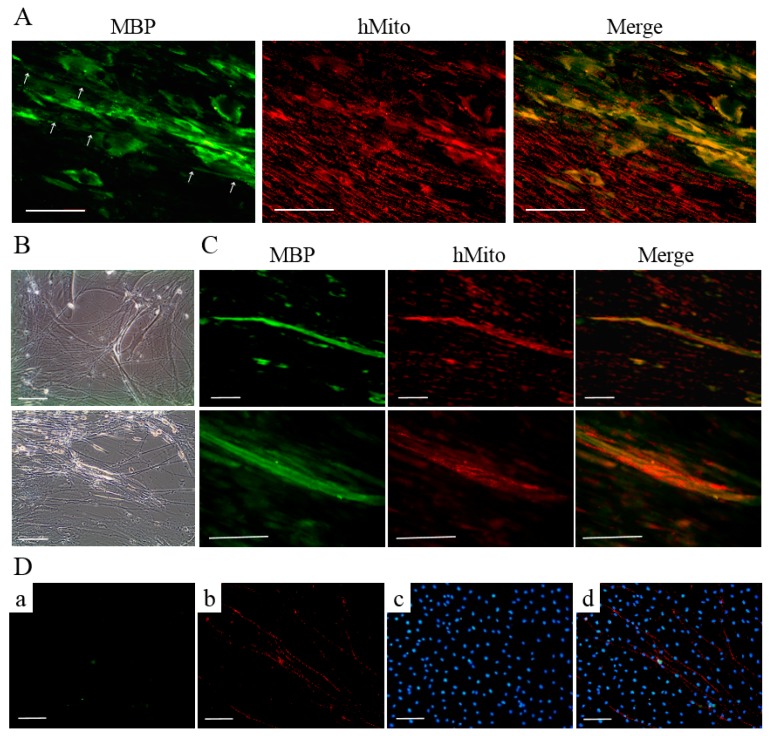
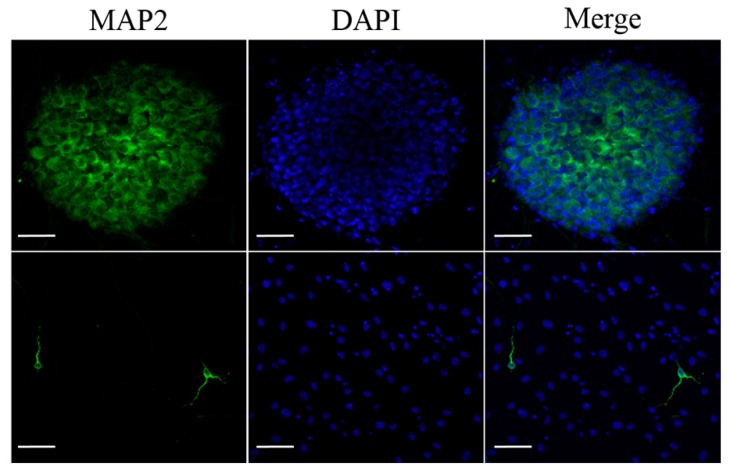
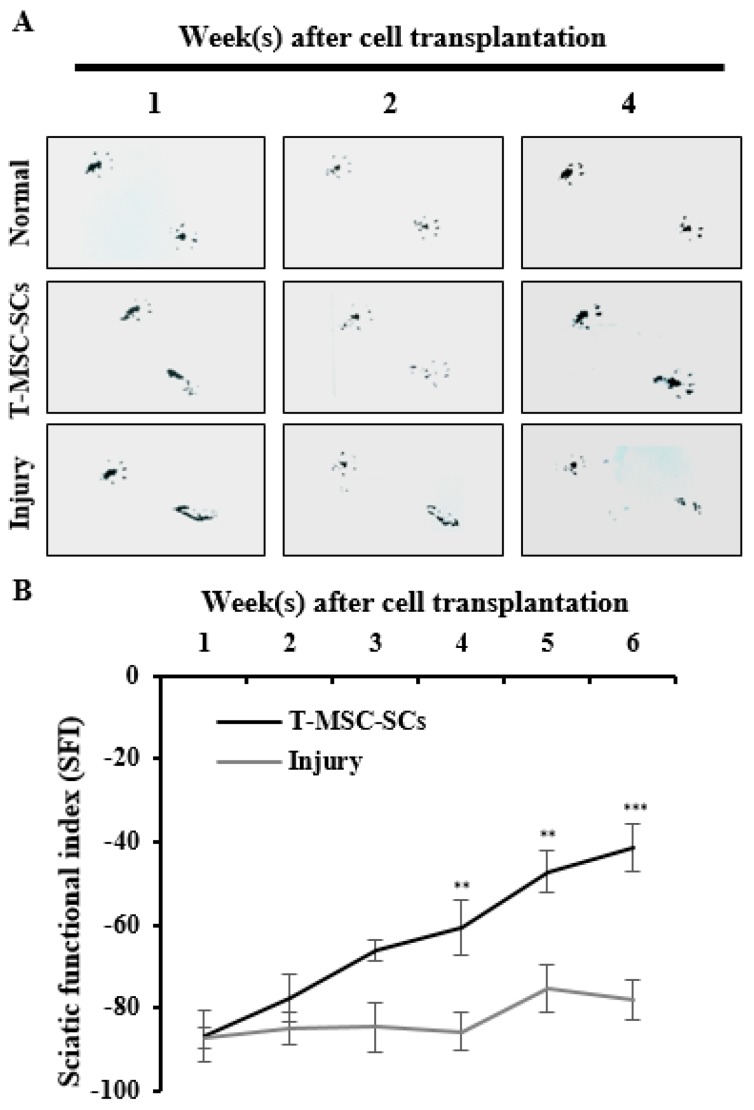
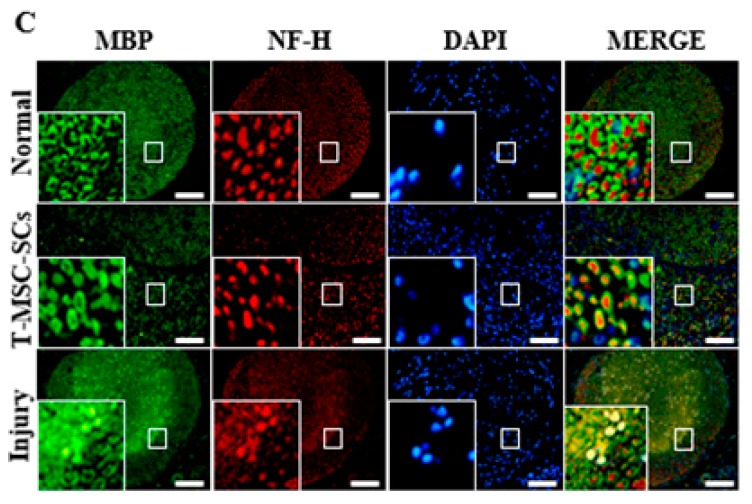
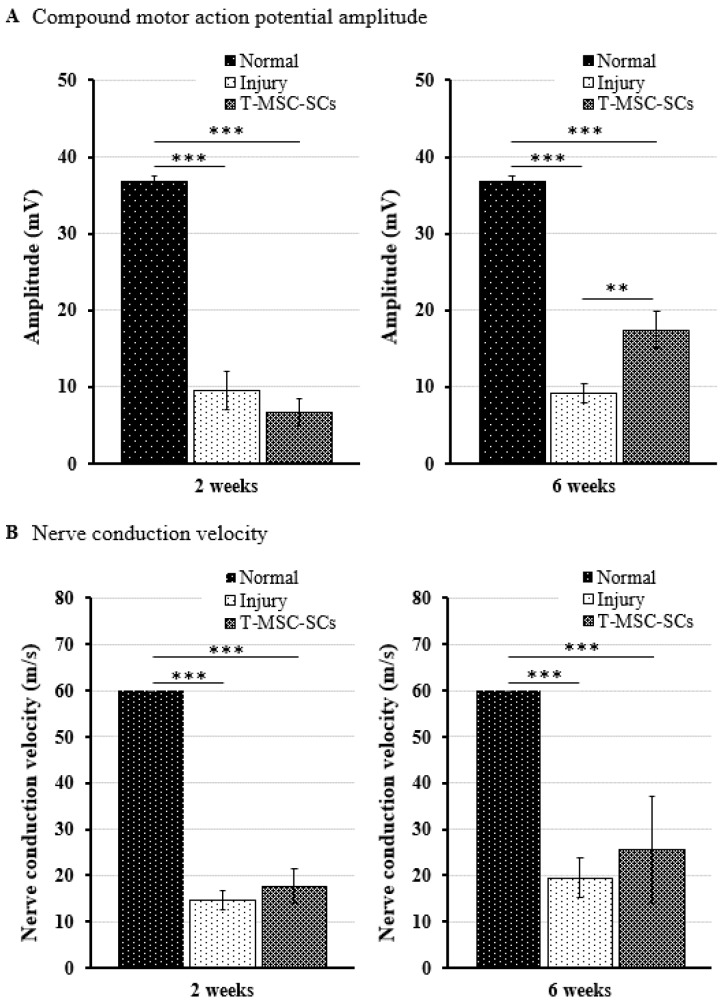
Schwann cells (SCs), which produce neurotropic factors and adhesive molecules, have been reported previously to contribute to structural support and guidance during axonal regeneration; therefore, they are potentially a crucial target in the restoration of injured nervous tissues. Autologous SC transplantation has been performed and has shown promising clinical results for treating nerve injuries and donor site morbidity, and insufficient production of the cells have been considered as a major issue. Here, we performed differentiation of tonsil-derived mesenchymal stem cells (T-MSCs) into SC-like cells (T-MSC-SCs), to evaluate T-MSC-SCs as an alternative to SCs. Using SC markers such as CAD19, GFAP, MBP, NGFR, S100B, and KROX20 during quantitative real-time PCR we detected the upregulation of NGFR, S100B, and KROX20 and the downregulation of CAD19 and MBP at the fully differentiated stage. Furthermore, we found myelination of axons when differentiated SCs were cocultured with mouse dorsal root ganglion neurons. The application of T-MSC-SCs to a mouse model of sciatic nerve injury produced marked improvements in gait and promoted regeneration of damaged nerves. Thus, the transplantation of human T-MSCs might be suitable for assisting in peripheral nerve regeneration.

Keywords: Schwann cell; differentiation; peripheral nerve; regeneration; tonsil-derived mesenchymal stem cells.


Conflict of interest statement

The authors declare no conflict of interest.

Figures

Figure 1
Figure 1
Characterization of tonsil-derived mesenchymal stem cells (T-MSCs) as mesenchymal stem cells: (A) the patterns of mesenchymal stem cells (MSC) surface markers were determined fluorescence-activated cell sorter (FACS) Calibur flow cytometer. Gray histogram profile indicates the isotype control, and white histogram indicates the specific antibody; and (B) T-MSCs differentiated into adipocytes, osteoblasts and chondrocytes, as determined by Oil Red O, Alizarin Red S staining, and Alcian blue, respectively. Negative control staining (upper row) and mesodermal differentiated T-MSC (lower row). Scale bars indicate each length.
Figure 2
Figure 2
Schematic diagram for the differentiation of T-MSCs into T-MSC-SCs. The method for differentiation of T-MSCs into T-MSC-SCs comprised several steps, including: (A) T-MSC expansion; (B) neurosphere formation; (C,D) SC differentiation; and (E) dorsal root ganglion (DRG) coculture. Images were acquired on an Olympus IX51 microscope equipped with NA0.30 objective lenses (original magnification in A, B, and C, ×40; in D, and E, ×100). Scale bar = 50 µm.
Figure 3
Figure 3
RT-qPCR analyses of CAD19, GFAP, KROX20, KROX24, MBP, NGFR, and S100B genes in T-MSCs, T-MSC-NSs and T-MSC-SCs. Expression levels were normalized against expression of the housekeeping gene encoding glyceraldehyde 3-phosphate dehydrogenase (GAPDH), and the results are reported as ratios of the marker gene expression versus undifferentiated T-MSCs. The calculation of relative gene expression level was analyzed using the comparative Ct method (2ΔΔCt). Data are presented as the mean ± SE of at least three experiments. Statistical analysis used one-way ANOVA followed by Newman–Keuls multiple comparison tests (* p < 0.05; ** p < 0.01; *** p < 0.001).
Figure 4
Figure 4
Identification of SC markers in T-MSCs and T-MSC-SCs: (A) immunocytochemical staining for GFAP (blue, DAPI; green, GFAP) and NGFR (blue, DAPI; green, NGFR) expression levels were compared before and after SC induction; (B) Western blot and quantitation graphs of GFAP and NGFR expression levels were compared between T-MSC and T-MSC-SC cells; and (C) GFAP and NGFR expressions in T-MSC-SCs were sustained over additional passages. The constitutively expressed GAPDH protein was used as a positive loading control. Data are presented as the mean ± SE of at least three experiments. The statistical analysis was performed using Student’s t-test (** p < 0.01; *** p < 0.001). Scale bar = 100 µm.
Figure 4
Figure 4
Identification of SC markers in T-MSCs and T-MSC-SCs: (A) immunocytochemical staining for GFAP (blue, DAPI; green, GFAP) and NGFR (blue, DAPI; green, NGFR) expression levels were compared before and after SC induction; (B) Western blot and quantitation graphs of GFAP and NGFR expression levels were compared between T-MSC and T-MSC-SC cells; and (C) GFAP and NGFR expressions in T-MSC-SCs were sustained over additional passages. The constitutively expressed GAPDH protein was used as a positive loading control. Data are presented as the mean ± SE of at least three experiments. The statistical analysis was performed using Student’s t-test (** p < 0.01; *** p < 0.001). Scale bar = 100 µm.
Figure 5
Figure 5
T-MSC-SCs promote neurite outgrowth in NSC34 cells: (A) NSC34 cells were grown in PM, DM, CM, or SM and monitored using phase-contrast microscopy; (B) Graphs represent the percentages of NSC34 cells showing neurites and the mean lengths of the longest neurites in different culture conditions; (C) RT-qPCR analyses of the BDNF, GDNF and NGF genes in T-MSCs, T-MSC-NSs, T-MSC-SCs, and human Schwann cells (HSC). Expression levels were normalized against expression of the housekeeping gene encoding glyceraldehyde 3-phosphate dehydrogenase (GAPDH), and the results are reported as ratios of the marker gene expression versus undifferentiated T-MSCs. Data are presented as the mean ± SE of at least three experiments. Statistical analysis used one-way ANOVA followed by Newman–Keuls multiple comparison tests (* p < 0.05; ** p < 0.01; *** p < 0.001).
Figure 6
Figure 6
DRG neurons cocultured with T-MSC-SCs: (A) immunocytochemical staining of human mitochondria (red) and MBP (green) represent the MBP-positive, but nonmyelinating T-MSC-SCs that are assembled around the small-caliber axons (white arrow); (B) phase-contrast images of the association between T-MSC-SCs and neurite bundles extending from mouse DRG explants; and (C) immunocytochemical staining for human mitochondria (red) and MBP (green) indicate the formation of myelin sheaths by T-MSC-SCs. Lower rows are enlargements of the myelinated areas of images in the upper row; (D) Immunocytochemistry of DRG neurons cultured without T-MSC-SCs did not show MBP-positive axons ((a) MBP; (b) NF-H; (c) DAPI; (d) Merge). Scale bar = 100 μm.
Figure 7
Figure 7
Dendritic marker staining of DRG neurons. Dendritic marker MAP2 immunostaining of sensory neurons in the DRG (upper row) and sensory neurons migrating from the DRG (lower row). Scale bar = 50 µm.
Figure 8
Figure 8
Mouse footprints and immunohistochemistry of the mouse sciatic nerve: (A) Mouse footprints at one two and four weeks after cell transplantation. The lower footprints represent the injured side in the T-MSC-SC transplantation group (T-MSC-SCs), injured control group (injury), and non-injured control (normal). Toes were clearly separate from Week 2 in the transplantation group. No significant change was observed in the injury group; (B) The SFI from footprinting analysis six weeks after surgery (n = 6 for each group). Statistical analyses included two-way ANOVA with Bonferroni post hoc tests (** p < 0.01; *** p < 0.001); (C) Immunohistochemistry of the mouse sciatic nerve six weeks after surgery. Immunofluorescent double staining of sciatic nerve tissue was performed with antibodies to MBP (green, a myelin marker), NF-H (red, an axonal marker) and DAPI (blue). The transplantation group showed regenerating axons surrounded by SCs. Original magnification 400×. Scale bar = 200 µm.
Figure 8
Figure 8
Mouse footprints and immunohistochemistry of the mouse sciatic nerve: (A) Mouse footprints at one two and four weeks after cell transplantation. The lower footprints represent the injured side in the T-MSC-SC transplantation group (T-MSC-SCs), injured control group (injury), and non-injured control (normal). Toes were clearly separate from Week 2 in the transplantation group. No significant change was observed in the injury group; (B) The SFI from footprinting analysis six weeks after surgery (n = 6 for each group). Statistical analyses included two-way ANOVA with Bonferroni post hoc tests (** p < 0.01; *** p < 0.001); (C) Immunohistochemistry of the mouse sciatic nerve six weeks after surgery. Immunofluorescent double staining of sciatic nerve tissue was performed with antibodies to MBP (green, a myelin marker), NF-H (red, an axonal marker) and DAPI (blue). The transplantation group showed regenerating axons surrounded by SCs. Original magnification 400×. Scale bar = 200 µm.
Figure 9
Figure 9
For electrophysiological analyses, the compound motor action potential (CMAP) amplitudes and motor nerve conduction velocity (NCV) were determined using Nicolet VikingQuest. Comparison of the CMAP amplitudes (A) and NCV (B) of the operated side in the injury and transplantation groups at two and six weeks after surgery. The CMAP amplitude and NCV of the non-injured control (normal) groups were 36.74 ± 0.82 mV and 60 ± 0 m/s, respectively. Statistical analyses were performed using two-way ANOVA with Bonferroni post hoc tests (** p < 0.01; *** p < 0.001).

Similar articles

Cited by

References

    1. Monk K.R., Feltri M.L., Taveggia C. New insights on schwann cell development. Glia. 2015;63:1376–1393. doi: 10.1002/glia.22852. - DOI - PMC - PubMed
    1. Gaudet A.D., Popovich P.G., Ramer M.S. Wallerian degeneration: Gaining perspective on inflammatory events after peripheral nerve injury. J. Neuroinflamm. 2011;8:110. doi: 10.1186/1742-2094-8-110. - DOI - PMC - PubMed
    1. Lee Y.C., Chang M.H., Lin K.P. Charcot-Marie-Tooth disease. Acta Neurol. Taiwan. 2008;17:203–213. - PubMed
    1. Pereira J.A., Lebrun-Julien F., Suter U. Molecular mechanisms regulating myelination in the peripheral nervous system. Trends Neurosci. 2012;35:123–134. doi: 10.1016/j.tins.2011.11.006. - DOI - PubMed
    1. Viader A., Sasaki Y., Kim S., Strickland A., Workman C.S., Yang K., Gross R.W., Milbrandt J. Aberrant schwann cell lipid metabolism linked to mitochondrial deficits leads to axon degeneration and neuropathy. Neuron. 2013;77:886–898. doi: 10.1016/j.neuron.2013.01.012. - DOI - PMC - PubMed

MeSH terms