

Internet of Things Platform for Smart Farming: Experiences and Lessons Learnt
- PMID: 27834862
- PMCID: PMC5134543
- DOI: 10.3390/s16111884
Internet of Things Platform for Smart Farming: Experiences and Lessons Learnt
Abstract
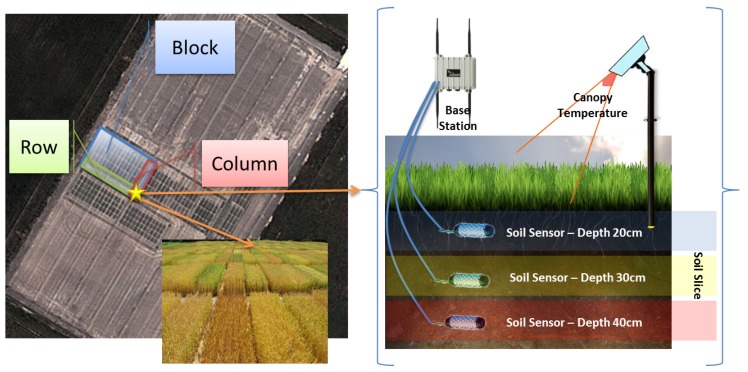
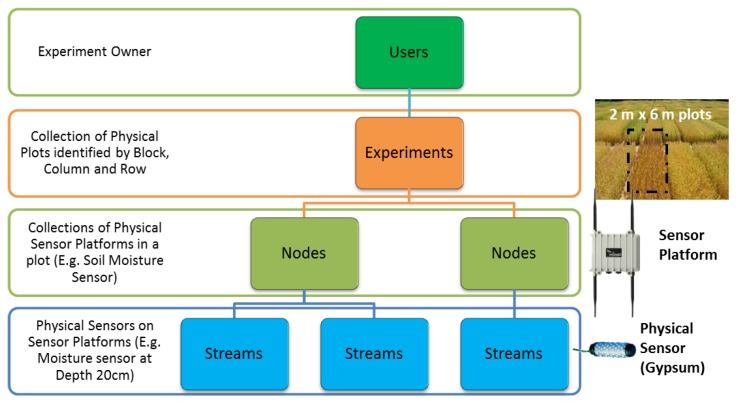
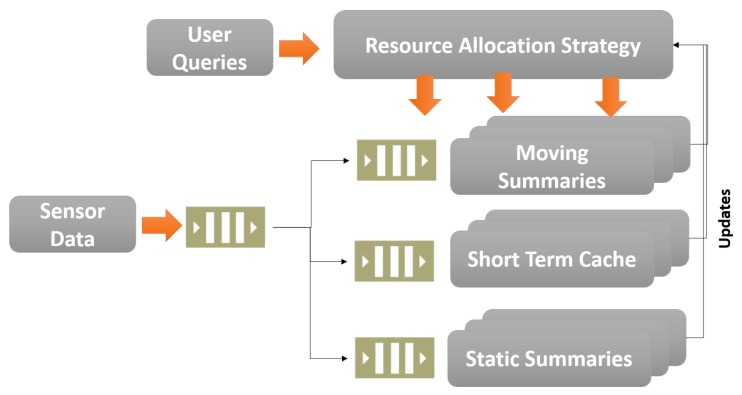
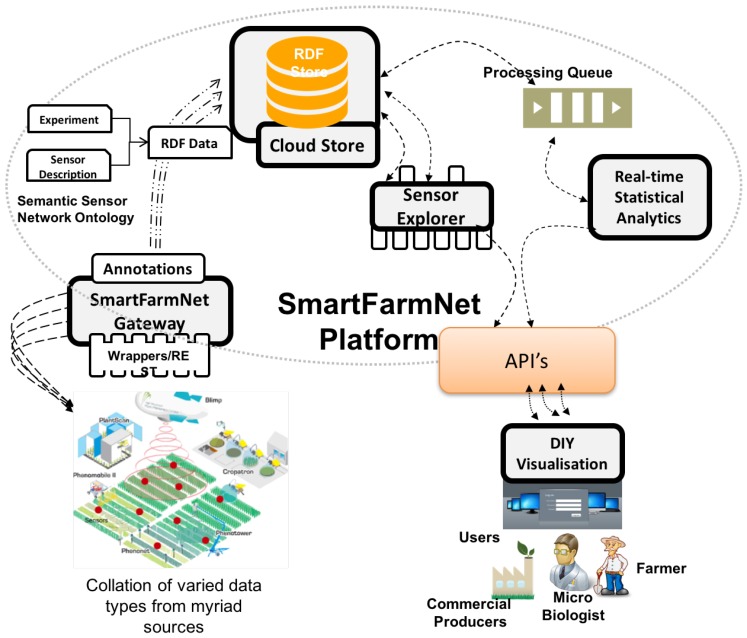
Improving farm productivity is essential for increasing farm profitability and meeting the rapidly growing demand for food that is fuelled by rapid population growth across the world. Farm productivity can be increased by understanding and forecasting crop performance in a variety of environmental conditions. Crop recommendation is currently based on data collected in field-based agricultural studies that capture crop performance under a variety of conditions (e.g., soil quality and environmental conditions). However, crop performance data collection is currently slow, as such crop studies are often undertaken in remote and distributed locations, and such data are typically collected manually. Furthermore, the quality of manually collected crop performance data is very low, because it does not take into account earlier conditions that have not been observed by the human operators but is essential to filter out collected data that will lead to invalid conclusions (e.g., solar radiation readings in the afternoon after even a short rain or overcast in the morning are invalid, and should not be used in assessing crop performance). Emerging Internet of Things (IoT) technologies, such as IoT devices (e.g., wireless sensor networks, network-connected weather stations, cameras, and smart phones) can be used to collate vast amount of environmental and crop performance data, ranging from time series data from sensors, to spatial data from cameras, to human observations collected and recorded via mobile smart phone applications. Such data can then be analysed to filter out invalid data and compute personalised crop recommendations for any specific farm. In this paper, we present the design of SmartFarmNet, an IoT-based platform that can automate the collection of environmental, soil, fertilisation, and irrigation data; automatically correlate such data and filter-out invalid data from the perspective of assessing crop performance; and compute crop forecasts and personalised crop recommendations for any particular farm. SmartFarmNet can integrate virtually any IoT device, including commercially available sensors, cameras, weather stations, etc., and store their data in the cloud for performance analysis and recommendations. An evaluation of the SmartFarmNet platform and our experiences and lessons learnt in developing this system concludes the paper. SmartFarmNet is the first and currently largest system in the world (in terms of the number of sensors attached, crops assessed, and users it supports) that provides crop performance analysis and recommendations.
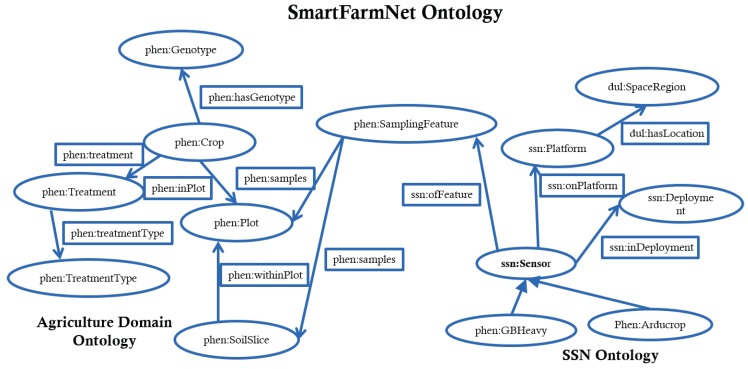
Keywords: Internet of Things; semantic web; smart agriculture.
Conflict of interest statement
The authors declare no conflict of interest.
Figures
References
-
- Department of Agriculture and Water Resources, Australian Government Maintaining Food Security in Australia. [(accessed on 6 September 2016)];2016 Jun; Available online: http://www.agriculture.gov.au/ag-farm-food/food/publications/national_fo....
-
- FAO. 2016. [(accessed on 8 July 2016)]. Available online: http://www.fao.org/home/en/
-
- Phenomics. 2016. [(accessed on 11 July 2016)]. Available online: https://en.wikipedia.org/wiki/Phenomics.
-
- Salehi A., Jimenez-Berni J., Deery D.M., Palmer D., Holland E., Rozas-Larraondo P., Chapman S.C., Georgakopoulos D., Furbank R.T. SensorDB: A virtual laboratory for the integration, visualization and analysis of varied biological sensor data. Plant Methods. 2015;11:53. doi: 10.1186/s13007-015-0097-z. - DOI - PMC - PubMed
-
- Jayaraman P.P., Palmer D., Zaslavsky A., Georgakopoulos D. Do-it-Yourself Digital Agriculture applications with semantically enhanced IoT platform; Proceedings of the 2015 IEEE Tenth International Conference on Intelligent Sensors, Sensor Networks and Information Processing (ISSNIP); Singapore. 7–9 April 2015; pp. 1–6.
LinkOut - more resources
Full Text Sources
Other Literature Sources
