. 2016 Nov 29;7(48):79925-79942.
doi: 10.18632/oncotarget.13160.

CD99 triggering induces methuosis of Ewing sarcoma cells through IGF-1R/RAS/Rac1 signaling

Affiliations

CD99 triggering induces methuosis of Ewing sarcoma cells through IGF-1R/RAS/Rac1 signaling

Maria Cristina Manara et al. Oncotarget. .

Abstract

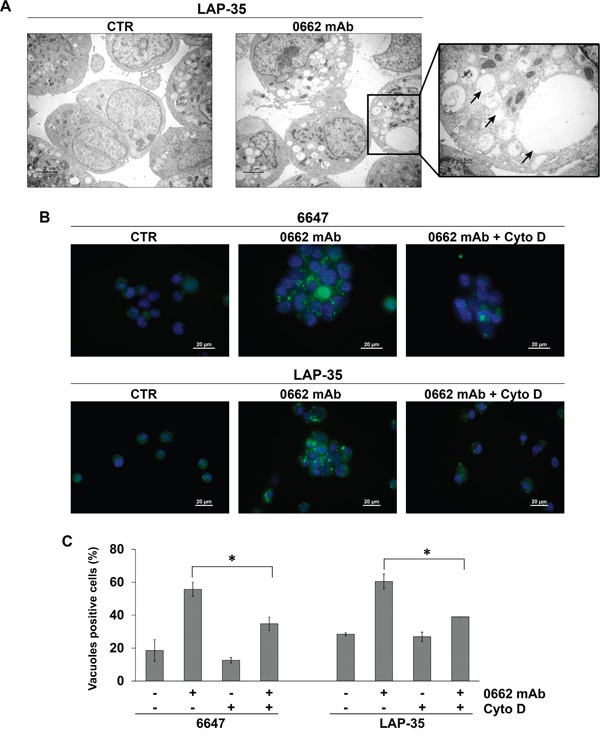
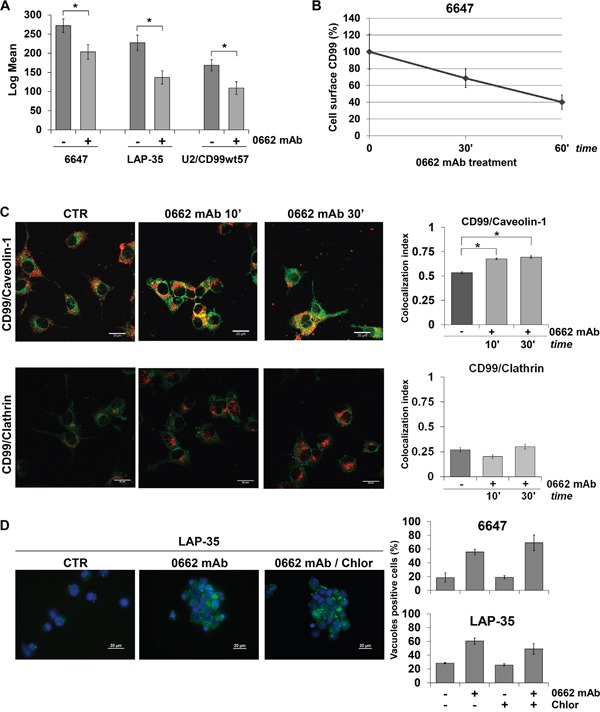
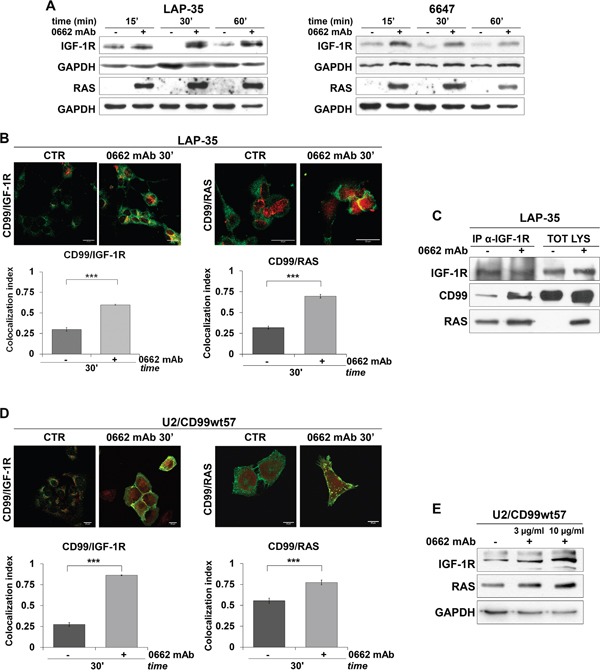
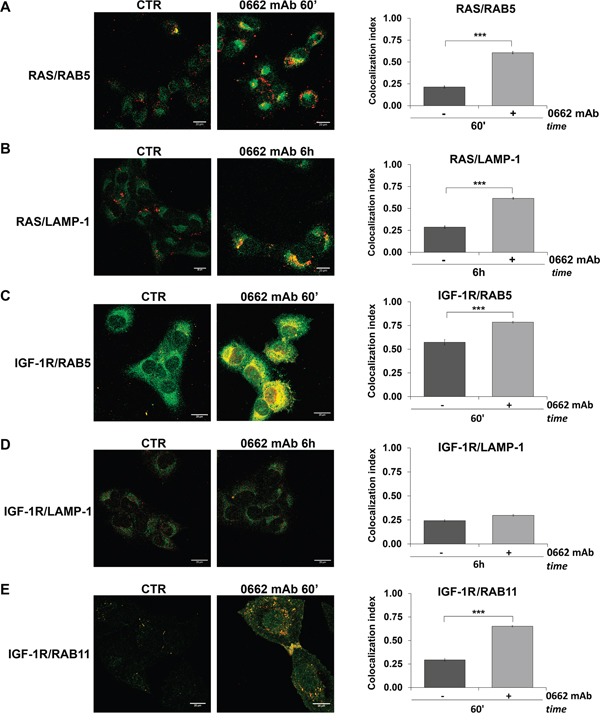
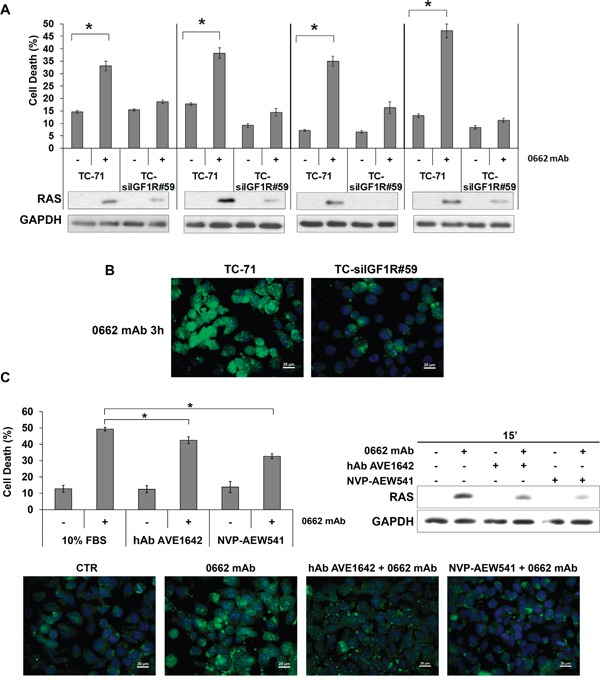
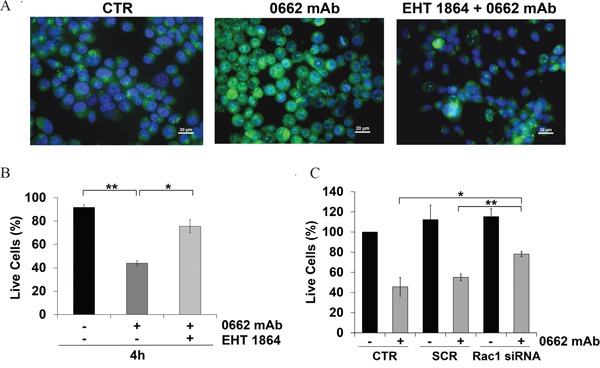
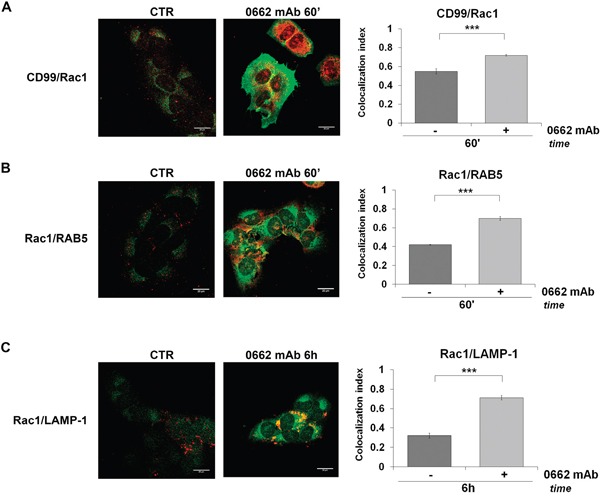
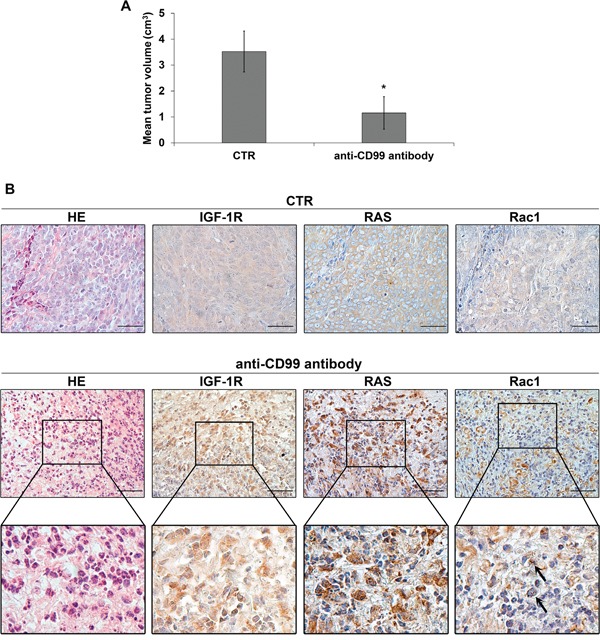
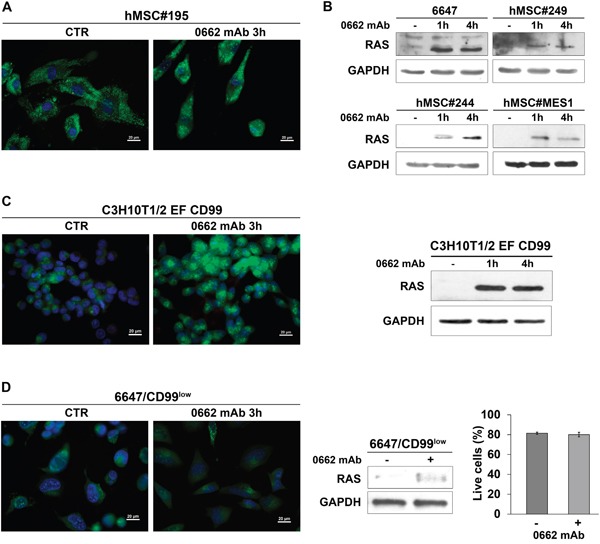
CD99 is a cell surface molecule that has emerged as a novel target for Ewing sarcoma (EWS), an aggressive pediatric bone cancer. This report provides the first evidence of methuosis in EWS, a non-apoptotic form of cell death induced by an antibody directed against the CD99 molecule. Upon mAb triggering, CD99 induces an IGF-1R/RAS/Rac1 complex, which is internalized into RAB5-positive endocytic vacuoles. This complex is then dissociated, with the IGF-1R recycling to the cell membrane while CD99 and RAS/Rac1 are sorted into immature LAMP-1-positive vacuoles, whose excessive accumulation provokes methuosis. This process, which is not detected in CD99-expressing normal mesenchymal cells, is inhibited by disruption of the IGF-1R signaling, whereas enhanced by IGF-1 stimulation. Induction of IGF-1R/RAS/Rac1 was also observed in the EWS xenografts that respond to anti-CD99 mAb, further supporting the role of the IGF/RAS/Rac1 axis in the hyperstimulation of macropinocytosis and selective death of EWS cells. Thus, we describe a vulnerability of EWS cells, including those resistant to standard chemotherapy, to a treatment with anti-CD99 mAb, which requires IGF-1R/RAS signaling but bypasses the need for their direct targeting. Overall, we propose CD99 targeting as new opportunity to treat EWS patients resistant to canonical apoptosis-inducing agents.

Keywords: CD99; Ewing sarcoma; RAS; antibody; cell death.


Conflict of interest statement

CONFLICTS OF INTEREST

The authors declare that they have no conflicts of interest.

Figures

Figure 1
Figure 1. CD99 engagement by 0662 monoclonal antibody induces macropinocytosis in EWS cells
A. Transmission electron microscopy of untreated (CTR) or 0662mAb-treated LAP-35 cells (scale bar 2μm). The right panel is a magnification of mAb-treated sample (scale bar 0.5μm). Arrows indicate empty vacuoles, void of cytoplasm and organelles. B. Lucifer yellow (LY) accumulation in 6647 or LAP-35 EWS cells in presence or not of Cytochalasin D (Cyto D) after 30 min 0662mAb exposure. Images were acquired with a Nikon ECLIPSE 90i with Plan Apo 60x/NA 1.4 DIC N2 (scale bar 20μm). C. Percentage of LY-positive 6647 and LAP-35 cells in presence or absence of 0662mAb (30 min) and/or Cyto D (60 min pretreatment). Results are represented as mean ± SEM of three independent experiments (*p<0.05, Student's t test).
Figure 2
Figure 2. CD99 is internalized after 0662mAb exposure
A. Intensity of CD99 surface expression before (−) and after (+) 0662mAb treatment (60 min) by flow cytometry. Results are represented as mean ± SEM of three independent experiments (*p<0.05, Student's t test). B. CD99 surface expression in 6647 cells by ELISA assay after 0662mAb treatment. Optical density was measured at 405nm. Data indicate mean relative CD99 expression ± SEM, referred to control absorbance. C. Colocalization between CD99 and Caveolin-1 or CD99 and Clathrin in LAP-35 cells before (CTR) and after 0662mAb treatments is shown by confocal microscopy. CD99 was labeled in green, Caveolin-1 or Clathrin in red (scale bar 20μm) (*p<0.05, Student's t test). Colocalization analysis was calculated by Nis Elements AR4.20.01 software (Nikon) and MCC was represented by histograms, as mean ± SEM of an average of one hundred cells from at least 10 independent fields. D. LY uptake in EWS cells exposed to 0662mAb for 30 min in presence or not of Chlorpromazine (10μg/ml) (scale bar 20μm). Left panels: representative images of LAP-35 cells. Right panels: percentage of LY-positive 6647 or LAP-35 cells in presence or absence of 0662mAb and/or Chlorpromazine. Results are represented as mean ± SEM of three independent experiments (Student's t test: n.s).
Figure 3
Figure 3. CD99, IGF-1R and RAS interact upon 0662mAb exposure
A. Western blot analysis of IGF-1R and pan-RAS on cell lysates from control (−) or 0662mAb-treated (+) EWS cells at the indicated times. Equal sample loading was monitored by anti-GAPDH blotting. B. Confocal microscopy shows colocalization between endogenous CD99 and IGF-1R (left panel) or CD99 and RAS (right panel) in LAP-35 before (CTR) and after treatment with 0662mAb. Representative images are shown. CD99 was labeled in green, IGF-1R or RAS in red (scale bar 20μm). Values are expressed as mean ± SEM (***p<0.001, Student's t test). C. Coimmunoprecipitation of endogenous IGF-1R, RAS and CD99 in LAP-35 before and after treatment with 0662mAb. D. Confocal microscopy shows colocalization between endogenous CD99 and IGF-1R (left panel) or CD99 and RAS (right panel) in U2/CD99wt57 cells before and after treatment with 0662mAb. CD99 was labeled in green, IGF-1R or RAS in red (scale bar 20μm) (***p<0.001, Student's t test). E. Western blot analysis of IGF-1R and pan-RAS on cell lysates from control (−) or 0662mAb-treated (+) U2/CD99wt57 cells. Loading was monitored by anti-GAPDH blotting. Colocalization analysis was calculated by Nis Elements AR4.20.01 software (Nikon) and MCC was represented by histograms as mean values ± SEM (***p<0.001, Student's t test).
Figure 4
Figure 4. RAS and IGF-1R are sorted into early endosomes but the latter is recycled to the cell surface
Confocal microscopy in U2/CD99wt57 before (CTR) and after 0662mAb treatment shows colocalization for: A. RAS (green) and RAB5 (red); B. RAS (green) and LAMP-1 (red); C. IGF-1R (green) and RAB5 (red); D. IGF-1R (green) and LAMP-1 (red); E. IGF-1R (red) and RAB11 (green) (scale bar 20μm). Representative images are displayed. Colocalization analysis was calculated by Nis Elements AR4.20.01 software (Nikon) and MCC was represented by histograms as mean values ± SEM. (***p<0.001, Student's t test).
Figure 5
Figure 5. IGF-1R expression and activity are required for CD99-mediated methuosis
A. CD99-induced cell death in parental or IGF-1R silenced TC-71 cells (Annexin V/PI) (upper panel). Results are represented as mean ± SEM of three independent experiments (*p<0.05, Student's t test). Western blotting evaluation of pan-RAS levels before (−) and after (+) treatment with 0662mAb in corresponding cells (lower panel). B. Vacuolization was assessed by Acridine Orange staining (AO) after 0662mAb treatment in parental (TC-71) or IGF-1R silenced cells (TC-siIGF1R#59) (scale bar 20μm). C. Experiments were performed in TC-71 cells before (−) and after (+) 15 min treatment with 0662mAb alone or in presence of either hAb AVE1642 or NVP-AEW541 (Annexin V/PI). Histograms (upper left panel) represent mean percentage ± SEM of dead cells (*p<0.05, Student's t test); western blotting (upper right panel) evaluates pan-RAS levels in the same conditions. Lower panels display AO staining before (CTR) and after 3h treatment with 0662mAb alone or in presence of either hAb AVE1642 or NVP-AEW541. For AO staining, cells were acquired using the microscope Nikon ECLIPSE 90i with Plan Fluor 40x/0.75 DIC M/N2. Pictures provided in the figures are all merged images.
Figure 6
Figure 6. Rac1 inhibition reverts CD99-mediated effects
A. AO staining was performed in 6647 cells before (CTR) or after exposure with 0662mAb (3h) alone or combined with the Rac1 inhibitor EHT 1864 (25 μM). For AO staining, cells were acquired using the microscope Nikon ECLIPSE 90i with Plan Fluor 40x/0.75 DIC M/N2. Pictures provided are all merged images (scale bar 20μm). B. Percentage of 6647 live cells before (−) and after (+) treatment with anti-CD99 0662mAb alone, or with Rac1 inhibitor EHT 1864 (25 μM for 48 h pretreatment) (trypan blue dye exclusion). C. Percentage of live 6647 cells before (−) and after (+) treatment with anti-CD99 0662mAb and/or with siRNA against Rac1. Cells were transfected by a scrambled (SCR) as control (trypan blue dye exclusion). Results are expressed as mean ± SEM of three or more independent experiments (Student's t test: *p< 0.05; **p<0.01).
Figure 7
Figure 7. Rac1 colocalizes with CD99 and is sorted into vacuoles after 0662mAb treatment
In U2/CD99wt57 before (CTR) and after 0662mAb treatment confocal microscopy shows colocalizations for A. CD99 (green) and Rac1 (red); B. Rac1 (green) and RAB5 (red); C. Rac1 (green) and LAMP-1 (red) (scale bar 20μm). Representative images are displayed. Colocalization index (MCC) represented by histograms was calculated by Nis Elements AR4.20.01 software (Nikon) and expressed as mean values ± SEM (***p<0.001, Student's t test).
Figure 8
Figure 8. IGF-1R/RAS/Rac1 signaling is activated upon anti-CD99 treatment in vivo
A. Mean tumor volumes in control and in CD99-antibody treated mice (Values are mean ± SEM, *p<0.05, Student's t test). B. Representative immunohistochemical evaluation of IGF-1R, RAS and Rac1 expression in untreated or anti-CD99 treated mice. Hematoxilin and Eosin staining was used to evaluate cell morphology. Enlarged views of the boxed regions are shown below. Arrows indicate Rac1 positive vesicles (scale bar 50μm).
Figure 9
Figure 9. RAS and CD99 levels are crucial for 0662mAb-induced vacuolization
A. AO staining of human mesenchymal stem cells (hMSCs) treated or not (CTR) with the anti-CD99 0662mAb. Representative merged images are shown (scale bar 20μm). B. Western blotting evaluation of pan-RAS levels before (−) and after treatment with anti-CD99 0662mAb in 6647 cells or hMSC cells. GAPDH was used as loading control. C. Left: AO staining of murine MSCs transfected with EWS/FLI1 and CD99 (C3H10T1/2 EF CD99) treated or not (CTR) with the anti-CD99 0662mAb. Representative merged images are shown (scale bar 20μm). Right: western blotting evaluation of pan-RAS levels before (−) and after treatment with 0662mAb in C3H10T1/2 EF CD99. GAPDH was used as loading control. D. Left: AO staining of 6647/CD99low cells treated or not (CTR) with the anti-CD99 0662mAb. Representative merged images are shown (scale bar 20μm). Middle: western blotting evaluation of pan-RAS levels before (−) and after (+) treatment with 0662mAb for 1h in 6647/CD99low. GAPDH was used as loading control. Right: percentage of live cells before (−) and after (+) treatment with anti-0662mAb in 6647/CD99low (Annexin V/PI assay). Values represent mean ± SEM of three independent experiments (Student's t test: p> 0.05).

Similar articles

Cited by

References

    1. Crompton BD, Stewart C, Taylor-Weiner A, Alexe G, Kurek KC, Calicchio ML, Kiezun A, Carter SL, Shukla SA, Mehta SS, Thorner AR, de Torres C, Lavarino C, Sunol M, McKenna A, Sivachenko A, et al. The genomic landscape of pediatric Ewing sarcoma. Cancer Discov. 2014;4:1326–1341. - PubMed
    1. Tirode F, Surdez D, Ma X, Parker M, Le Deley MC, Bahrami A, Zhang Z, Lapouble E, Grossetete-Lalami S, Rusch M, Reynaud S, Rio-Frio T, Hedlund E, Wu G, Chen X, Pierron G, et al. Genomic landscape of Ewing sarcoma defines an aggressive subtype with co-association of STAG2 and TP53 mutations. Cancer Discov. 2014;4:1342–1353. - PMC - PubMed
    1. Delattre O, Zucman J, Plougastel B, Desmaze C, Melot T, Peter M, Kovar H, Joubert I, de Jong P, Rouleau G, et al. Gene fusion with an ETS DNA-binding domain caused by chromosome translocation in human tumours. Nature. 1992;359:162–165. - PubMed
    1. Kovar H. Blocking the road, stopping the engine or killing the driver? Advances in targeting EWS/FLI-1 fusion in Ewing sarcoma as novel therapy. Expert Opin Ther Targets. 2014;18:1315–1328. - PubMed
    1. Zhuo R, Kosak KM, Sankar S, Wiles ET, Sun Y, Zhang J, Ayello J, Prestwich GD, Shami PJ, Cairo MS, Lessnick SL, Luo W. Targeting Glutathione S-transferase M4 in Ewing sarcoma. Front Pediatr. 2014;2:83. - PMC - PubMed

MeSH terms