. 2016 Nov 11;12(11):e1006423.
doi: 10.1371/journal.pgen.1006423. eCollection 2016 Nov.

Survey of the Heritability and Sparse Architecture of Gene Expression Traits across Human Tissues

Affiliations

Survey of the Heritability and Sparse Architecture of Gene Expression Traits across Human Tissues

Heather E Wheeler et al. PLoS Genet. .

Abstract

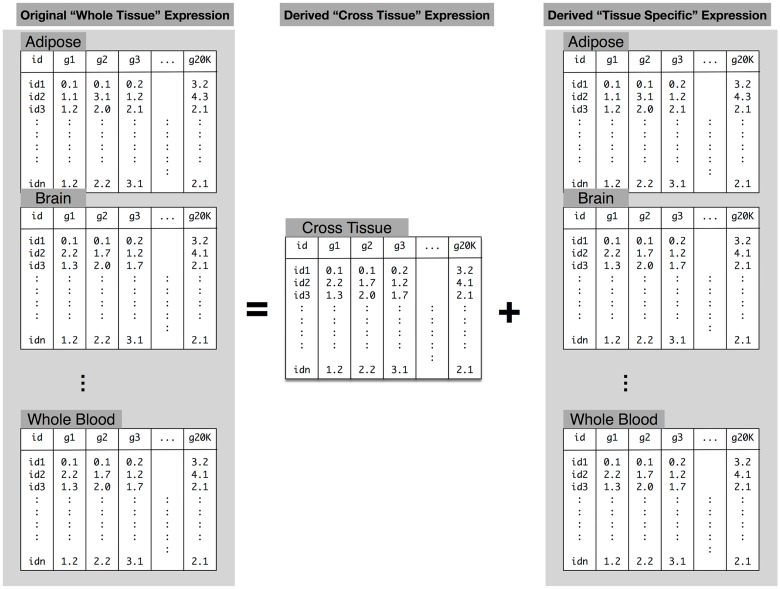
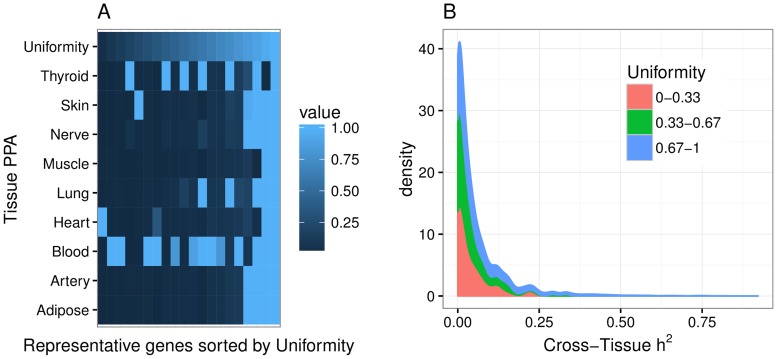
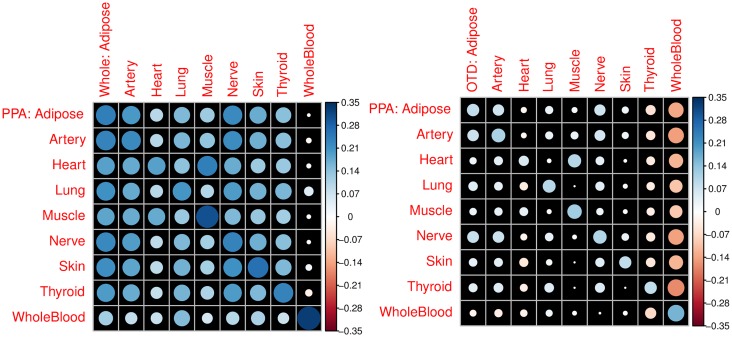
Understanding the genetic architecture of gene expression traits is key to elucidating the underlying mechanisms of complex traits. Here, for the first time, we perform a systematic survey of the heritability and the distribution of effect sizes across all representative tissues in the human body. We find that local h2 can be relatively well characterized with 59% of expressed genes showing significant h2 (FDR < 0.1) in the DGN whole blood cohort. However, current sample sizes (n ≤ 922) do not allow us to compute distal h2. Bayesian Sparse Linear Mixed Model (BSLMM) analysis provides strong evidence that the genetic contribution to local expression traits is dominated by a handful of genetic variants rather than by the collective contribution of a large number of variants each of modest size. In other words, the local architecture of gene expression traits is sparse rather than polygenic across all 40 tissues (from DGN and GTEx) examined. This result is confirmed by the sparsity of optimal performing gene expression predictors via elastic net modeling. To further explore the tissue context specificity, we decompose the expression traits into cross-tissue and tissue-specific components using a novel Orthogonal Tissue Decomposition (OTD) approach. Through a series of simulations we show that the cross-tissue and tissue-specific components are identifiable via OTD. Heritability and sparsity estimates of these derived expression phenotypes show similar characteristics to the original traits. Consistent properties relative to prior GTEx multi-tissue analysis results suggest that these traits reflect the expected biology. Finally, we apply this knowledge to develop prediction models of gene expression traits for all tissues. The prediction models, heritability, and prediction performance R2 for original and decomposed expression phenotypes are made publicly available (https://github.com/hakyimlab/PrediXcan).


Conflict of interest statement

The authors have declared that no competing interests exist.

Figures

Fig 1
Fig 1. Genes with heritable expression in DGN whole blood are more tolerant to loss of function mutations.
The distribution of the probability of being loss-of-function intolerant (pLI) for each gene (from the Exome Aggregation Consortium [32]) dichotomized by local heritability estimates. The Kruskal-Wallis rank sum test revealed a significant difference in the pLI of heritability groups (χ2 = 234, P < 10−52). More heritable genes (h2 > 0.1 in blue) have lower pLI metrics and are thus more tolerant to mutation than genes with lower h2.
Fig 2
Fig 2. Sparsity estimates using Bayesian Sparse Linear Mixed Models in DGN whole blood.
(A) This panel shows a measure of sparsity of the gene expression traits represented by the PGE parameter from the BSLMM approach. PGE is the proportion of the sparse component of the total variance explained by genetic variants, PVE (the BSLMM equivalent of h2). The median of the posterior samples of BSLMM output is used as estimates of these parameters. Genes with a lower credible set (LCS) > 0.01 are shown in blue and the rest in red. The 95% credible set of each estimate is shown in gray. For highly heritable genes the sparse component is close to 1, thus for high heritability genes the local architecture is sparse. For lower heritability genes, there is not enough evidence to determine sparsity or polygenicity. (B) This panel shows the heritability estimate from BSLMM (PVE) vs the estimates from GCTA, which are found to be similar (R = 0.96). Here, the estimates are constrained to be between 0 and 1 in both models. Each point is colored according to that gene’s elastic net α = 1 cross-validated prediction correlation squared (EN R2). Note genes with high heritability have high prediction R2, as expected.
Fig 3
Fig 3. DGN cross-validated predictive performance across the elastic net.
Elastic net prediction models were built in the DGN whole blood and performance was quantified by the cross-validated R2 between observed and predicted expression levels. (A) This panel shows the 10-fold cross validated R2 for 51 genes with R2 > 0.3 from chromosome 22 as a function of the elastic net mixing parameters (α). Smaller mixing parameters correspond to more polygenic models while larger ones correspond to more sparse models. Each line represents a gene. The performance is in general flat for most values of the mixing parameter except very close to zero where it shows a pronounced dip. Thus polygenic models perform more poorly than sparse models. (B) This panel shows the difference between the cross validated R2 of the LASSO model and the elastic net model mixing parameters 0.05 and 0.5 for autosomal protein coding genes. Elastic net with α = 0.5 values hover around zero, meaning that it has similar predictive performance to LASSO. The R2 difference of the more polygenic model (elastic net with α = 0.05) is mostly above the 0 line, indicating that this model performs worse than the LASSO model.
Fig 4
Fig 4. BSLMM vs LMM estimates of heritability in GTEx.
This figure shows the comparison between estimates of heritability using BSLMM vs. LMM (GCTA) for GTEx data. Here, in both models the estimates are constrained to be between 0 and 1. For most genes BSLMM estimates are larger than LMM estimates reflecting the fact that BSLMM yields better estimates of heritability because of its ability to account for the sparse component. Each point is colored according to that gene’s prediction R2 (correlation squared between cross-validated elastic net prediction vs observed expression denoted EN R2). At the bottom right of each panel, we show the correlation between BSLMM (EN_v_BSLMM) and LMM (EN_v_LMM). BSLMM is consistently more correlated with the elastic net correlation. This provides further indication that the local architecture is predominantly sparse.
Fig 5
Fig 5. Orthogonal Tissue Decomposition of gene expression traits.
For a given gene, the expression level is decoupled into a component that is specific to the individual and another component that is specific to the individual and tissue. The left side of the equation in the figure corresponds to the original “whole tissue” expression levels. The right side has the component specific for the individual, independent of the tissue and the tissue-specific component. Given the lack of multiple replications for a given tissue/individual we use a mixed effects model with a random effect that is specific to the individual. The cross-tissue component is estimated as the posterior mean of the subject-specific random effect. The tissue-specific component is estimated as the residual of the model fit, i.e. the difference between the “whole tissue” expression and the cross-tissue component. The rationale is that once we remove the component that is common across tissues, the remaining will be specific to the tissue. Models are fit one gene at a time. Covariates are not shown to simplify the presentation.
Fig 6
Fig 6. Measure of uniformity of the posterior probability of active regulation vs. cross-tissue heritability.
Uniformity was computed using the posterior probability of a gene being actively regulated in a tissue, PPA, from the Flutre et al. [33] multi-tissue eQTL analysis. (A) Representative examples showing that genes with PPA concentrated in one tissue were assigned small values of the uniformity measure whereas genes with PPA uniformly distributed across tissues were assigned high value of uniformity measure. See Methods for the entropy-based definition of uniformity. (B) This panel shows the distribution of heritability of the cross-tissue component vs. a measure of uniformity of genetic regulation across tissues. The Kruskal-Wallis rank sum test revealed a significant difference in the cross-tissue h2 of uniformity groups (χ2 = 31.4, P < 10−6).
Fig 7
Fig 7. Comparison of heritability of whole tissue or tissue-specific components vs. PPA.
Panel (A) of this figure shows the Pearson correlation (R) between the BSLMM PVE of the original (we are calling whole here) tissue expression levels vs. the probability of the tissue being actively regulated in a given tissue (PPA). Matching tissues show, in general, the largest correlation values but most of the off diagonal correlations are also relatively high consistent with the shared regulation across tissues. Panel (B) shows the Pearson correlation between the PVE of the tissue-specific component of expression via orthogonal tissue decomposition (OTD) vs. PPA. Correlations are in general lower but matching tissues show the largest correlation. Off diagonal correlations are reduced substantially consistent with properties that are specific to each tissue. Area of each circle is proportional to the absolute value of R.

References

    1. Nicolae DL, Gamazon E, Zhang W, Duan S, Dolan ME, Cox NJ. Trait-Associated SNPs Are More Likely to Be eQTLs: Annotation to Enhance Discovery from GWAS. PLoS Genetics. 2010;6(4):e1000888 Available from: 10.1371/journal.pgen.1000888. - DOI - PMC - PubMed
    1. Nica AC, Montgomery SB, Dimas AS, Stranger BE, Beazley C, Barroso I, et al. Candidate Causal Regulatory Effects by Integration of Expression QTLs with Complex Trait Genetic Associations. PLoS Genetics. 2010;6(4):e1000895 Available from: 10.1371/journal.pgen.1000895. - DOI - PMC - PubMed
    1. Gusev A, Lee SH, Trynka G, Finucane H, Vilhjalmsson BJ, Xu H, et al. Partitioning Heritability of Regulatory and Cell-Type-Specific Variants across 11 Common Diseases. The American Journal of Human Genetics. 2014;95(5):535–552. Available from: 10.1016/j.ajhg.2014.10.004. - DOI - PMC - PubMed
    1. Torres JM, Gamazon ER, Parra EJ, Below JE, Valladares-Salgado A, Wacher N, et al. Cross-tissue and tissue-specific eQTLs: partitioning the heritability of a complex trait. The American Journal of Human Genetics. 2014;95(5):521–534. 10.1016/j.ajhg.2014.10.001 - DOI - PMC - PubMed
    1. Davis LK, Yu D, Keenan CL, Gamazon ER, Konkashbaev AI, Derks EM, et al. Partitioning the heritability of Tourette syndrome and obsessive compulsive disorder reveals differences in genetic architecture. PLoS Genet. 2013;. 10.1371/journal.pgen.1003864 - DOI - PMC - PubMed

LinkOut - more resources