. 2016 Nov 29;7(48):79670-79687.
doi: 10.18632/oncotarget.13216.

Enhancement of 5-FU sensitivity by the proapoptotic rpL3 gene in p53 null colon cancer cells through combined polymer nanoparticles

Affiliations

Enhancement of 5-FU sensitivity by the proapoptotic rpL3 gene in p53 null colon cancer cells through combined polymer nanoparticles

Annapina Russo et al. Oncotarget. .

Abstract

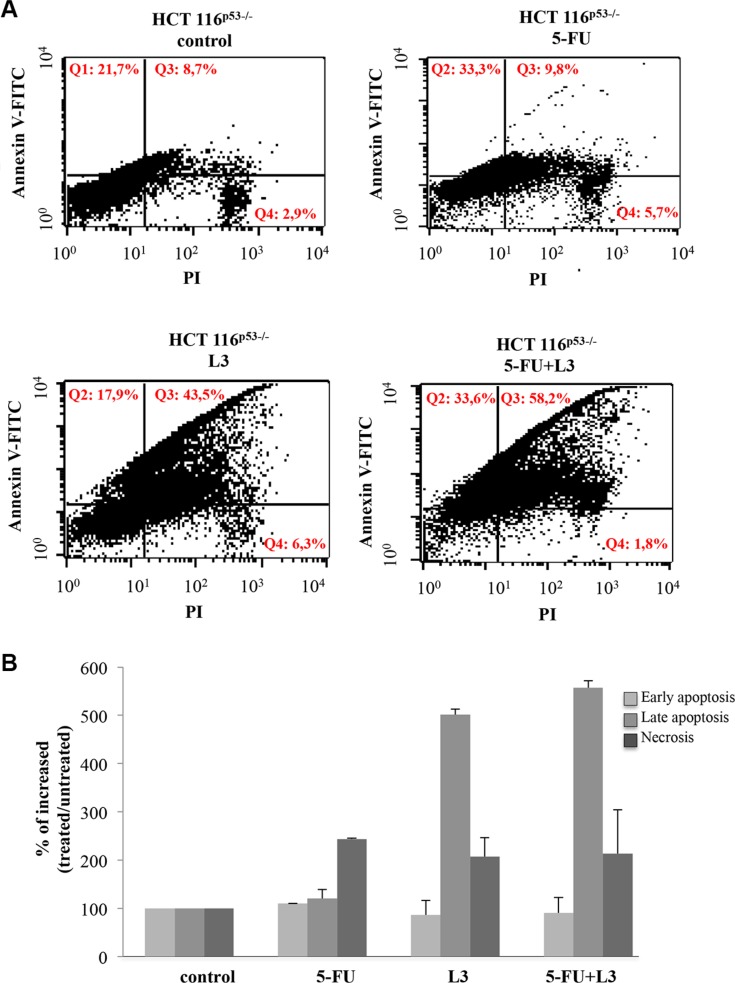
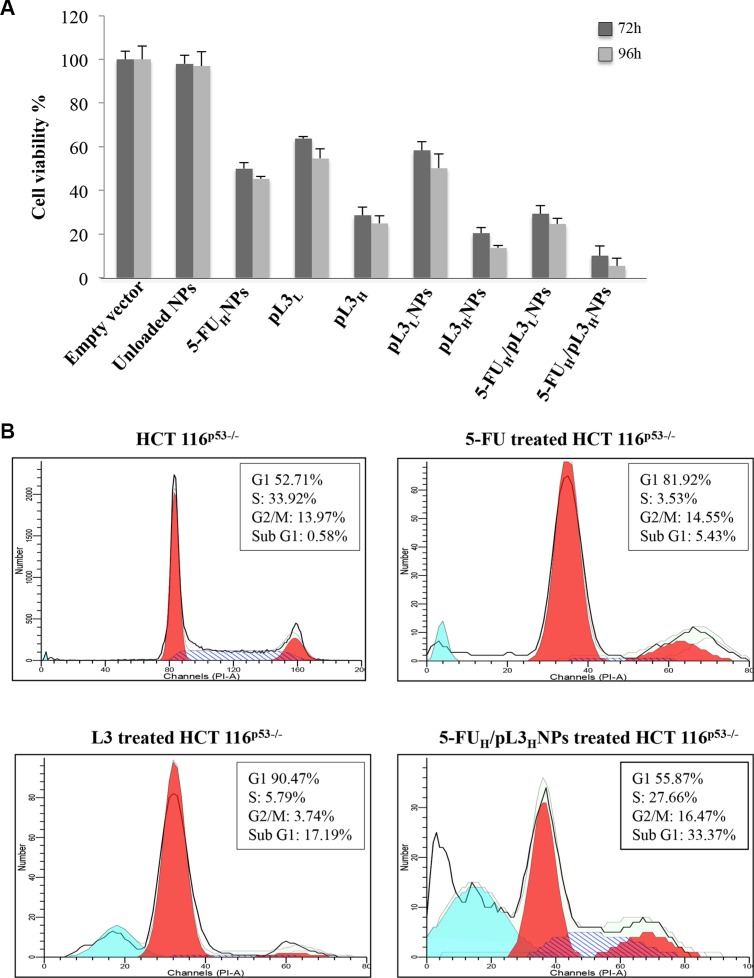
Colon cancer is one of the leading causes of cancer-related death worldwide and the therapy with 5-fluorouracil (5-FU) is mainly limited due to resistance. Recently, we have demonstrated that nucleolar stress upon 5-FU treatment leads to the activation of ribosome-free rpL3 (L3) as proapoptotic factor. In this study, we analyzed L3 expression profile in colon cancer tissues and demonstrated that L3 mRNA amount decreased with malignant progression and the intensity of its expression was inversely related to tumor grade and Bcl-2/Bax ratio. With the aim to develop a combined therapy of 5-FU plus plasmid encoding L3 (pL3), we firstly assessed the potentiation of the cytotoxic effect of 5-FU on colon cancer cells by L3. Next, 10 μM 5-FU and 2 μg of pL3 were encapsulated in biocompatible nanoparticles (NPs) chemically conjugated with HA to achieve active tumor-targeting ability in CD44 overexpressing cancer cells. We showed the specific intracellular accumulation of NPs in cells and a sustained release for 5-FU and L3. Analysis of cytotoxicity and apoptotic induction potential of combined NPs clearly showed that the 5-FU plus L3 were more effective in inducing apoptosis than 5-FU or L3 alone. Furthermore, we show that the cancer-specific chemosensitizer effect of combined NPs may be dependent on L3 ability to affect 5-FU efflux by controlling P-gp (P-glycoprotein) expression. These results led us to propose a novel combined therapy with the use of 5-FU plus L3 in order to establish individualized therapy by examining L3 profiles in tumors to yield a better clinical outcomes.

Keywords: 5-FU; apoptosis; colon cancer; p53; ribosomal protein rpL3.


Conflict of interest statement

CONFLICTS OF INTEREST

The authors declare no conflicts of interest.

Figures

Figure 1
Figure 1. Expression profile of L3, p21, Bax and Bcl-2 in normal colon tumor tissues and colon adenocarcinoma
qRT-PCR data showing (A) L3, p21, Bcl-2 and Bax mRNA levels in tumor tissues paired with the normal mucosa tissues set as 1. (B) L3 mRNA levels and (C) Bcl-2/Bax ratio among different groups of grade. NT: non tumor tissue. Results are shown as fold change (mean ± SEM) (n = 3) of normal mucosa tissues set as 1. Results illustrated in Figures 1–8, are representative of three independently performed experiments; error bars represent the standard deviation.
Figure 2
Figure 2. Role of L3 on cell viability, cell proliferation and migration upon 5-FU treatment
(A) HCT 116p53−/− and (B) rpL3ΔHCT 116p53−/− cells were transiently transfected with pL3 and treated with 10 μM 5-FU for 24 h, 48 h, 72 h and 96 h or untreated. Then, cell viability was evaluated using MTT assay. The cell viability from untreated cells was set to 100%. Results are presented as percentage (mean ± SEM) (n = 3) of the control cells. (C) Representative image of clonogenic analysis for cell proliferation in HCT 116p53−/−and rpL3ΔHCT 116p53−/− cells upon L3 overexpression and 5-FU treatment for 48 h. After 7 days, colonies were stained with methylene blue, photographed and counted. (D) HCT 116p53−/− and (E) rpL3ΔHCT 116p53−/−cells were transiently transfected with pL3 and treated with 10 μM 5-FU for 24 h and 48 h or untreated. Then migration of cells was examined using Boyden chamber. Cell migration of untreated cells was set to 100%. Results are presented as percentage (mean ± SEM) (n = 3) of the control cells.
Figure 3
Figure 3. Role of rpL3 on apoptosis upon 5-FU treatment
(A) HCT 116p53−/− and (B) rpL3ΔHCT 116p53−/− cells were transiently transfected with pL3 and treated with 10 μM 5-FU for 48 h or untreated. Then cells were analyzed for mitochondrial membrane potential by TMRE staining. Fluorescence was measured by flow cytometry. Results are presented as percentage of the control cells set as 100%. Results are presented as percentage (mean ± SEM) (n = 3) of the control cells. (C) HCT 116p53−/− cells were transiently transfected with pL3 and treated with 10 μM 5-FU for 48 h. Then, cell death was assessed by FACS analysis of Annexin V staining. Quantitative data are reported.
Figure 4
Figure 4. Analysis of apoptosis status upon combined treatment 5-FU+L3
HCT 116p53−/− cells were transiently transfected with pL3 and treated with 10 μM 5-FU for 48 h. Then, cell death was assessed by FACS analysis of Annexin V and PI staining. (A) Representative dot plots and (B) quantitative data are reported.
Figure 5
Figure 5. Structure and characterization of NPs delivering 5-FU+pL3
(A) Sketched representation of NPs delivering 5-FU+pL3. (B) Emission spectra (excitation = 530 nm) of ethidium bromide in the presence of pL3-loaded PLGA@PEI (0–100 μg/mL). (C) Gel retardation assay before and after sample treatment with DNAse: free pL3 (a), pL3-loaded PLGA@PEI (b), pL3-loaded HA-coated PLGA@PEI (c), (pL3 was 2 μg/mL). (D) Size distribution of the sample during the layering procedure. (E) Release profile of 5-FU and pL3 from combined NPs in DMEM FBS+.
Figure 6
Figure 6. Cellular uptake of pL3H/RhoNPs
Representative fluorescent miscroscopy images of HCT 116p53−/− cells treated with pL3H/RhoNPs for 24 h, 48 h and 72 h. Dapi was used as a nuclear stain (shown in blue); L3-GFP and NP dependent fluorescence (Rho) are shown in green and red, respectively. The CD44 receptor of HCT 116p53−/− cells was blocked with free HA 1 h before treatment with nanoparticles. Quantification of fluorescence intensity is shown. Results are presented as percentage (mean ± SEM) (n = 3) of the control cells set as 100%.
Figure 7
Figure 7. Effect of 5-FUH/pL3HNPs on cell viability and cell cycle in HCT 116p53−/− cells
(A) HCT 116p53−/− were treated with 2 μg of empty vector, unloaded NPs, 10 μM 5-FU loaded onto NPs (5-FUHNPs), 1 mg or 2 mg of free pL3 (pL3L or pL3H, respectively), 1 μg or 2 μg of pL3 loaded onto NPs (pL3LNPs or pL3HNPs, respectively), 10 μM 5-FU plus 1 μg or 2 μg of pL3 loaded onto NPs (5-FUH/pL3LNPs and 5-FUH/pL3HNPs, respectively) for 72 h and 96 h. After incubation, cell viability was evaluated using the MTT assay. The cell viability from untreated cells was set to 100%, control. Results are presented as percentage (mean ± SEM) (n = 3) of the control cells. (B) HCT 116p53−/− cells were treated with pL3H, 5-FU or 5-FUH/pL3HNPs for 48 h. Then, cells were stained with PI and analysed using FACS. Peaks representing histograms of cell numbers and percentages in G1, S, and G2/M phases are shown.
Figure 8
Figure 8. 5-FUH/pL3HNP treatment negatively regulates P-gp expression and MDR1 mRNA stability
(A) Representative western blot analysis showing time-dependent changes in L3-GFP, p21 and P-gp protein expression in HCT 116p53−/− cells after treatment with 5-FUH/pL3HNPs for 24 h, 48 h and 72 h. Densitometric quantification is shown. (B) HCT 116p53−/− and rpL3ΔHCT 116p53−/− cells were treated with 5-FUH/pL3HNPs for 24 h, 48 h and 72 h. Then, mRNA expression of MDR1 was detected by qRT-PCR. Quantification of signals is shown. (C) HCT 116p53−/− cells were treated with 5-FUH/pL3HNPs for 48 h. Then, 5 μg/μl Act D was added to the cells for 24 h. At the indicated time points (4 h, 8 h, 16 h and 24 h), total RNA was isolated and the mRNA levels of MDR1 and β-actin were determined by real-time PCR. The relative amount of MDR1 mRNA without Act D treatment was set to 100% and the percentage of MDR1 mRNA treated with Act D was calculated accordingly. Quantification of signals is shown.

Similar articles

Cited by

References

    1. Cuccurese M, Russo G, Russo A, Pietropaolo C. Alternative splicing and nonsense-mediated mRNA decay regulate mammalian ribosomal gene expression. Nucleic Acids Res. 2005;33:5965–5977. doi: 10.1093/nar/gki905. - DOI - PMC - PubMed
    1. Russo A, Russo G, Cuccurese M, Garbi C, Pietropaolo C. The 3′-untranslated region directs ribosomal protein-encoding mRNAs to specific cytoplasmic regions. Biochim Biophys Acta. 2006;1763:833–843. doi: 10.1016/j.bbamcr.2006.05.010. - DOI - PubMed
    1. Russo A, Cirulli C, Amoresano A, Pucci P, Pietropaolo C, Russo G. cis-acting sequences and trans-acting factors in the localization of mRNA for mitochondrial ribosomal proteins. Biochim Biophys Acta. 2008;1779:820–829. doi: 10.1016/j.bbagrm.2008.08.006. - DOI - PubMed
    1. Russo G, Cuccurese M, Monti G, Russo A, Amoresano A, Pucci P. Ribosomal protein L7a binds RNA through two distinct RNA-binding domains. Biochem J. 2005;385:289–299. doi: 10.1038/sj.bjp.0706112. - DOI - PMC - PubMed
    1. de Las Heras-Rubio A, Perucho L, Paciucci R, Vilardell J, ME LL. Ribosomal proteins as novel players in tumorigenesis. Cancer Metastasis Rev. 2014;33:115–141. doi: 10.1007/s10555-013-9460-6. - DOI - PubMed

MeSH terms