. 2017 Jan 15:97:208-217.
doi: 10.1016/j.ejps.2016.11.009. Epub 2016 Nov 9.

Activation of GPER ameliorates experimental pulmonary hypertension in male rats

Affiliations

Activation of GPER ameliorates experimental pulmonary hypertension in male rats

Allan K Alencar et al. Eur J Pharm Sci. .

Abstract

Rationale: Pulmonary hypertension (PH) is characterized by pulmonary vascular remodeling that leads to pulmonary congestion, uncompensated right-ventricle (RV) failure, and premature death. Preclinical studies have demonstrated that the G protein-coupled estrogen receptor (GPER) is cardioprotective in male rats and that its activation elicits vascular relaxation in rats of either sex.

Objectives: To study the effects of GPER on the cardiopulmonary system by the administration of its selective agonist G1 in male rats with monocrotaline (MCT)-induced PH.

Methods: Rats received a single intraperitoneal injection of MCT (60mg/kg) for PH induction. Experimental groups were as follows: control, MCT+vehicle, and MCT+G1 (400μg/kg/daysubcutaneous). Animals (n=5pergroup) were treated with vehicle or G1 for 14days after disease onset.

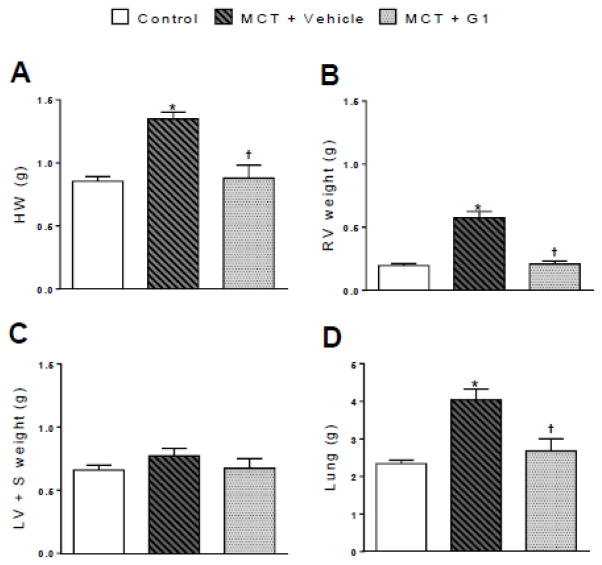
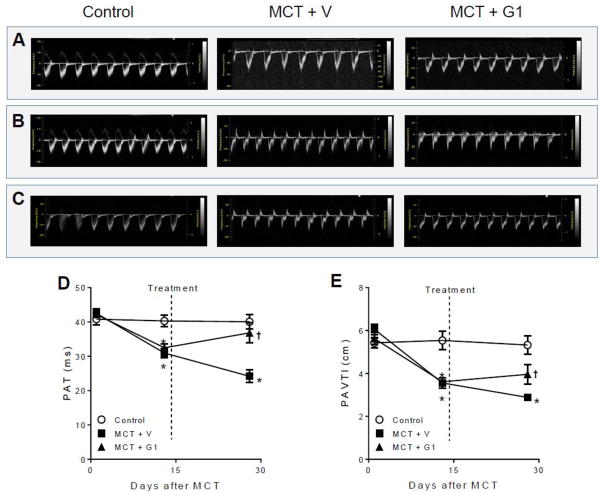
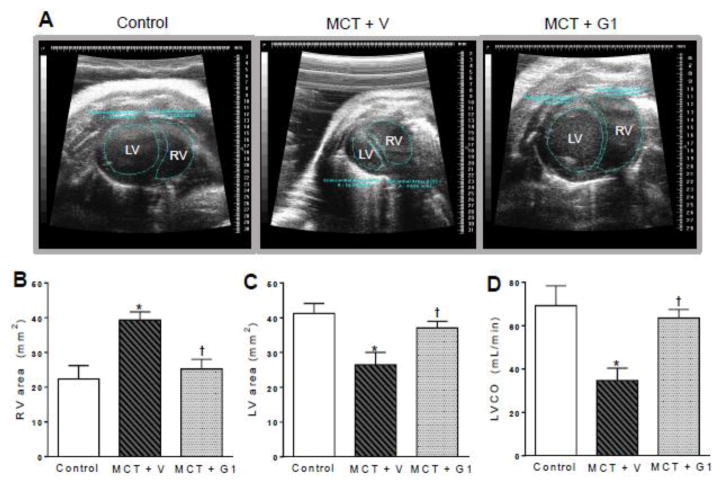
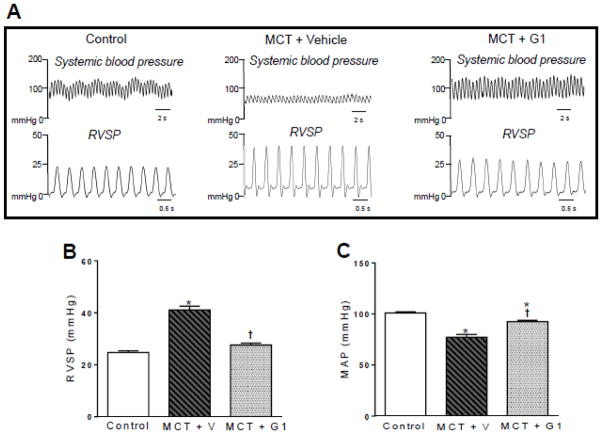
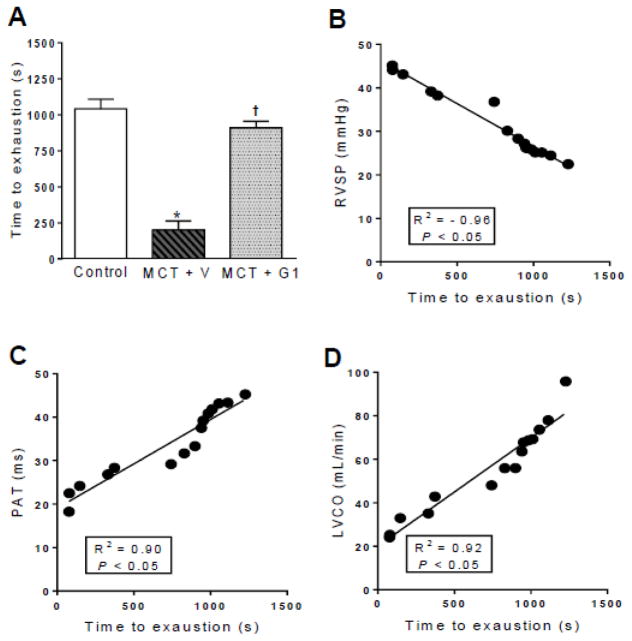
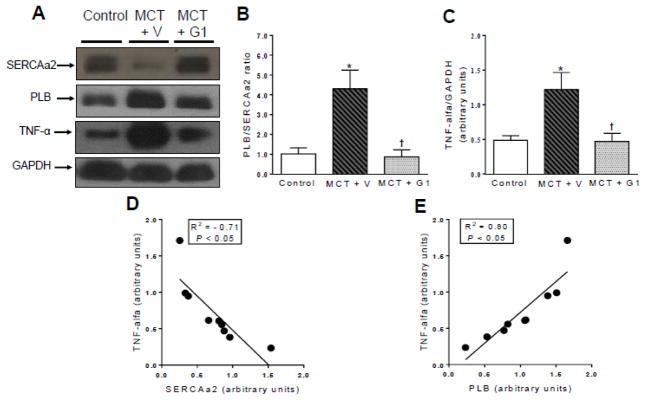
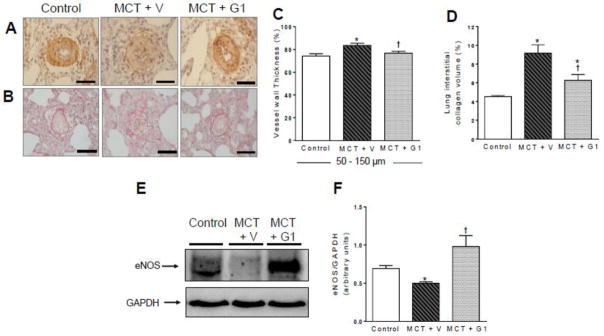
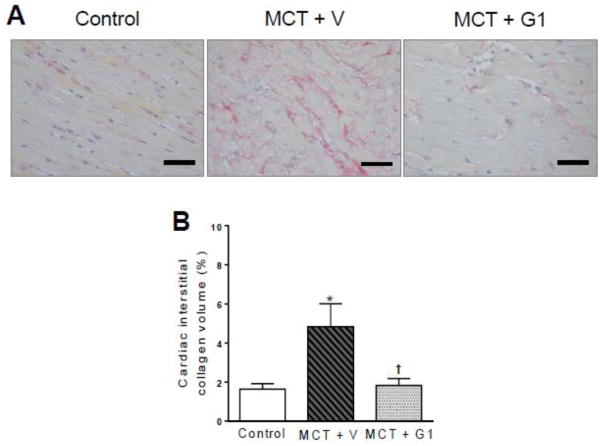
Measurements and main results: Activation of GPER attenuated exercise intolerance and reduced RV overload in PH rats. Rats with PH exhibited echocardiographic alterations, such as reduced pulmonary flow, RV hypertrophy, and left-ventricle dysfunction, by the end of protocol. G1 treatment reversed these PH-related abnormalities of cardiopulmonary function and structure, in part by promoting pulmonary endothelial nitric oxide synthesis, Ca2+ handling regulation and reduction of inflammation in cardiomyocytes, and a decrease of collagen deposition by acting in pulmonary and cardiac fibroblasts.

Conclusions: G1 was effective to reverse PH-induced RV dysfunction and exercise intolerance in male rats, a finding that have important implications for ongoing clinical evaluation of new cardioprotective and vasodilator drugs for the treatment of the disease.

Keywords: GPER; Monocrotaline; Right ventricular dysfunction; Vascular remodeling.


Conflict of interest statement

The authors declare that they have no conflict of interest.

Figures

Figure 1
Figure 1
Effects of the subcutaneous treatment with vehicle or G1 (400 μg/kg/day) on the heart and lung weights of MCT-injected rats. a heart weight, b right ventricle weight, c left ventricle plus septal weight, and d lung weight 29 days after monocrotaline injection. Each column and bar represent the mean ± S.E.M. (n = 5 rats per group). *P < 0.05 compared with control rats; †P < 0.05 compared with MCT + vehicle rats. HW, heart weight; RV, right ventricle; LV, left ventricle; S, septum; MCT, monocrotaline.
Figure 2
Figure 2
Effects of MCT injection on the pulmonary artery outflow profile over 28 days of protocol and subcutaneous treatment with vehicle or G1 (400 μg/kg/day) during 14 days. Representative images of pulmonary artery outflow profile are shown before (panel A), 14 days (panel B) and 28 days (panel C) after MCT injection. Pulmonary artery acceleration time and velocity time integral are shown in D and E, respectively. Data represent the mean ± S.E.M. (n = 5 rats per group). *P < 0.05 compared with control rats; †P < 0.05 compared with MCT + vehicle rats. PAT, pulmonary artery acceleration time; PAVTI, pulmonary artery velocity time; MCT, monocrotaline; V, vehicle
Figure 3
Figure 3
Effects of the subcutaneous treatment with vehicle or G1 (400 μg/kg/day) on heart structure and function of MCT-injected rats. a representative images of parasternal short-axis views obtained by B-mode echocardiography (all end-diastolic), b right ventricle area, c left ventricle area, and d left ventricular cardiac output 28 days after monocrotaline injection. Each column and bar represent the mean ± S.E.M. (n = 5 rats per group). *P < 0.05 compared with control rats; †P < 0.05 compared with MCT + vehicle rats. RV, right ventricle; LV, left ventricle; LVCO, left ventricular cardiac output; MCT, monocrotaline; V, vehicle.
Figure 4
Figure 4
Effects of the subcutaneous treatment with vehicle or G1 (400 μg/kg/day) on hemodynamic parameters of MCT-injected rats. a representative tracing of right ventricular systolic pressure and mean arterial pressure, b right ventricular systolic pressure, and c mean arterial pressure 29 days after monocrotaline injection. Each column and bar represent the mean ± S.E.M. (n = 5 rats per group). *P < 0.05 compared with control rats; †P < 0.05 compared with MCT + vehicle rats. RVSP, right ventricular systolic pressure; MAP, mean arterial pressure; MCT, monocrotaline; V, vehicle.
Figure 5
Figure 5
Effects of the subcutaneous treatment with vehicle or G1 (400 μg/kg/day) on exercise test protocol of MCT-injected rats. a time to exhaustion, b linear regression between RVSP and time to exhaustion, c linear regression between PAT and time to exhaustion, and d linear regression between LVCO and time to exhaustion 29 days after monocrotaline injection. Each column and bar represent the mean ± S.E.M. (n = 5 rats per group). *P < 0.05 compared with control rats; †P < 0.05 compared with MCT + vehicle rats. RVSP, right ventricular systolic pressure; PAT, pulmonary artery acceleration time, LVCO, left ventricular cardiac output, MCT, monocrotaline; V, vehicle.
Figure 6
Figure 6
Western blot analyses of a SERCA2a, PLB and TNF-α expression in right ventricle from control, MCT+ vehicle, and MCT+ G1 groups, respectively. GAPDH was used for normalization. b relative expression ratio of PLB to SERCA2a, c quantification of TNF-α expression, d linear regression between TNF-α and SERCA2a expression levels, and e linear regression between TNF-α and PLB expression levels. Each column and bar represent the mean ± S.E.M. (n = 3 rats per group). *P < 0.05 compared with control rats; †P < 0.05 compared with MCT + vehicle rats. SERCA2a, sarco/endoplasmic reticulum Ca2+-ATPase 2a; PLB, phospholamban; TNF-α, tumor necrosis factor-alpha; MCT, monocrotaline; V, vehicle.
Figure 7
Figure 7
Representative images of lung sections and western blot analysis of control and MCT-injected rats treated with vehicle or G1 (400 μg/kg/day). a and b show vessels at 40x magnification. Each bar represents 20μm. a immunohistochemical staining for alpha-actin, b picrosirius red staining, c vessel wall thickness expressed as a percent of the total area of the vessel ranging between 50–150 μm in external diameter, d collagen volume fraction of pulmonary arterioles in relation to the tissue area, e representative western blot of eNOS expression, and f quantification of eNOS expression levels; GAPDH was used as loading control. Each column and bar represent the mean ± S.E.M. (n = 3–5 rats per group). *P < 0.05 compared with control rats; †P < 0.05 compared with MCT + vehicle rats. eNOS, endothelial nitric oxide synthase; MCT, monocrotaline; V, vehicle.
Figure 8
Figure 8
Collagen volume analysis of the right ventricles from MCT-injected rats treated with vehicle or G1 (400 μg/kg/day). a picrosirius red staining under light microscopy (magnification 40×), showing collagen fibers in red, and b collagen volume fraction of right ventricles in relation to the tissue area. Each column and bar represent the mean ± S.E.M. (n = 5 rats per group). *P < 0.05 compared with control rats; †P < 0.05 compared with MCT + vehicle rats. MCT, monocrotaline, V, vehicle.

References

    1. “ESC/ERS Guidelines for the diagnosis and treatment of pulmonary hypertension. The Joint Task Force for the Diagnosis and Treatment of Pulmonary Hypertension of the European Society of Cardiology (ESC) and the European Respiratory Society (ERS).” Nazzareno Galie, Marc Humbert, Jean-Luc Vachiery, Simon Gibbs, Irene Lang, Adam Torbicki, Gerald Simonneau, Andrew Peacock, Anton Vonk Noordegraaf, Maurice Beghetti, Ardeschir Ghofrani, Miguel Angel Gomez Sanchez, Georg Hansmann, Walter Klepetko, Patrizio Lancellotti, Marco Matucci, Theresa McDonagh, Luc A. Pierard, Pedro T. Trindade, Maurizio Zompatori and Marius Hoeper. Eur Respir J 2015; 46: 903–975. Eur Respir J. 2015;46:1855–1856. - PubMed
    1. Alencar AK, da Silva JS, Lin M, Silva AM, Sun X, Ferrario CM, Cheng C, Sudo RT, Zapata-Sudo G, Wang H, Groban L. Effect of Age, Estrogen Status, and Late-Life GPER Activation on Cardiac Structure and Function in the Fischer344xBrown Norway Female Rat. J Gerontol A Biol Sci Med Sci 2016 - PMC - PubMed
    1. Alencar AK, Pereira SL, da Silva FE, Mendes LV, do Cunha VM, Lima LM, Montagnoli TL, Caruso-Neves C, Ferraz EB, Tesch R, Nascimento JH, Sant’anna CM, Fraga CA, Barreiro EJ, Sudo RT, Zapata-Sudo G. N-acylhydrazone derivative ameliorates monocrotaline-induced pulmonary hypertension through the modulation of adenosine AA2R activity. Int J Cardiol. 2014;173:154–162. - PubMed
    1. Alencar AK, Pereira SL, Montagnoli TL, Maia RC, Kummerle AE, Landgraf SS, Caruso-Neves C, Ferraz EB, Tesch R, Nascimento JH, de Sant’Anna CM, Fraga CA, Barreiro EJ, Sudo RT, Zapata-Sudo G. Beneficial effects of a novel agonist of the adenosine A2A receptor on monocrotaline-induced pulmonary hypertension in rats. Br J Pharmacol. 2013;169:953–962. - PMC - PubMed
    1. Ariazi EA, Brailoiu E, Yerrum S, Shupp HA, Slifker MJ, Cunliffe HE, Black MA, Donato AL, Arterburn JB, Oprea TI, Prossnitz ER, Dun NJ, Jordan VC. The G protein-coupled receptor GPR30 inhibits proliferation of estrogen receptor-positive breast cancer cells. Cancer Res. 2010;70:1184–1194. - PMC - PubMed

MeSH terms

Substances