. 2017 Jan;58(1):226-235.
doi: 10.1194/jlr.M072538. Epub 2016 Nov 11.

Mice lacking lipid droplet-associated hydrolase, a gene linked to human prostate cancer, have normal cholesterol ester metabolism

Affiliations

Mice lacking lipid droplet-associated hydrolase, a gene linked to human prostate cancer, have normal cholesterol ester metabolism

Nora Kory et al. J Lipid Res. 2017 Jan.

Abstract

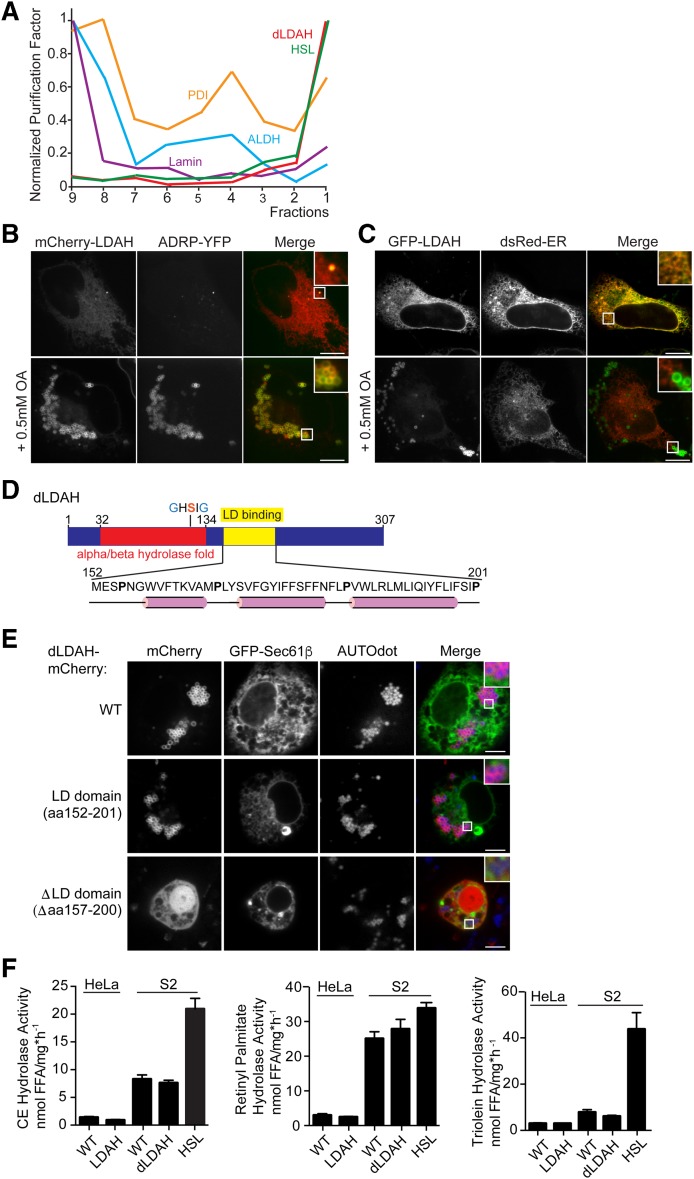
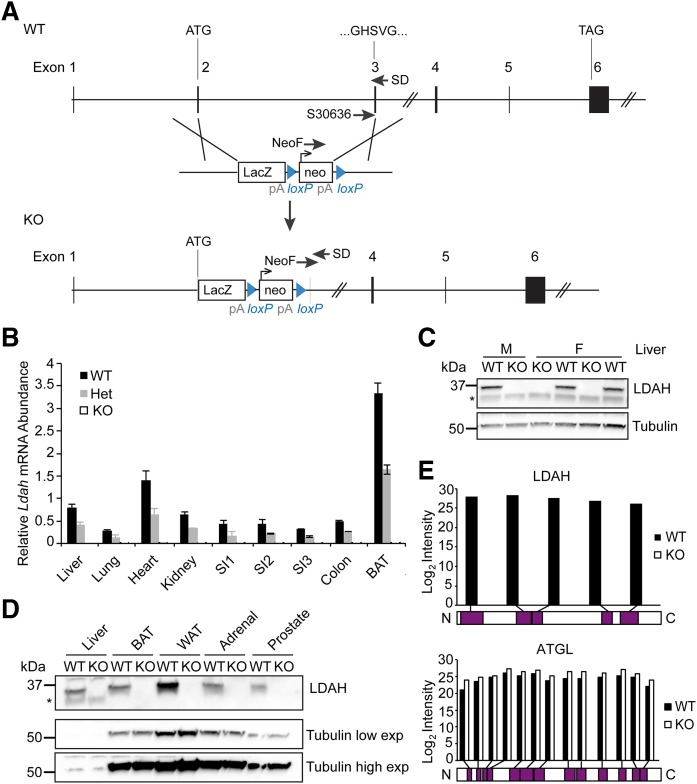
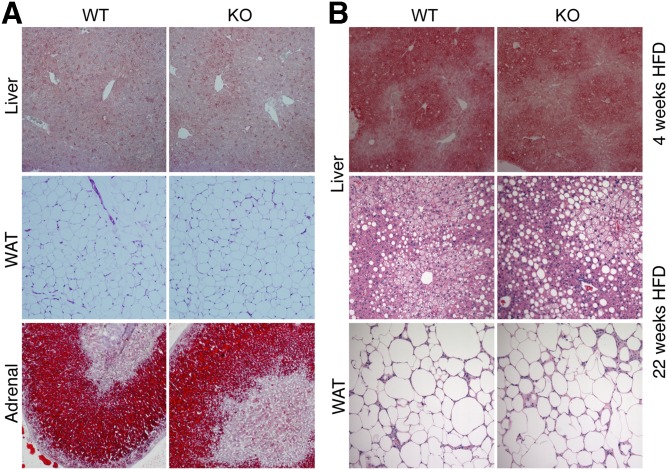
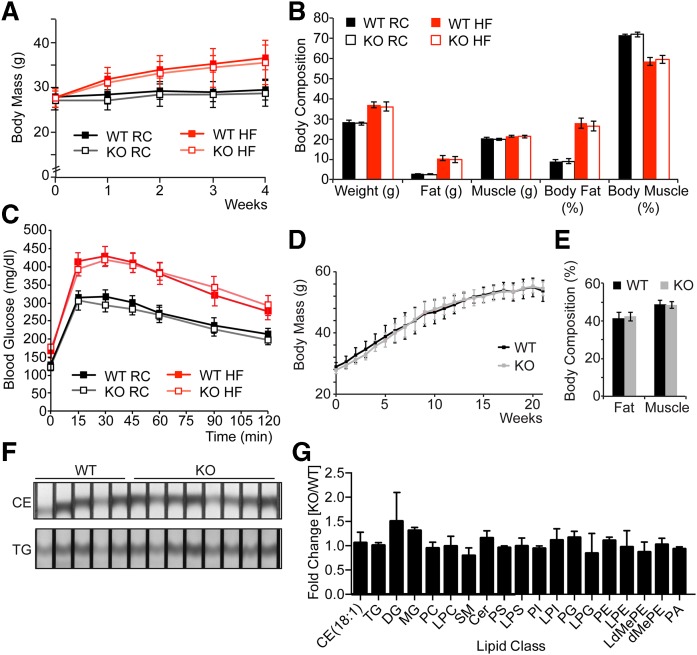
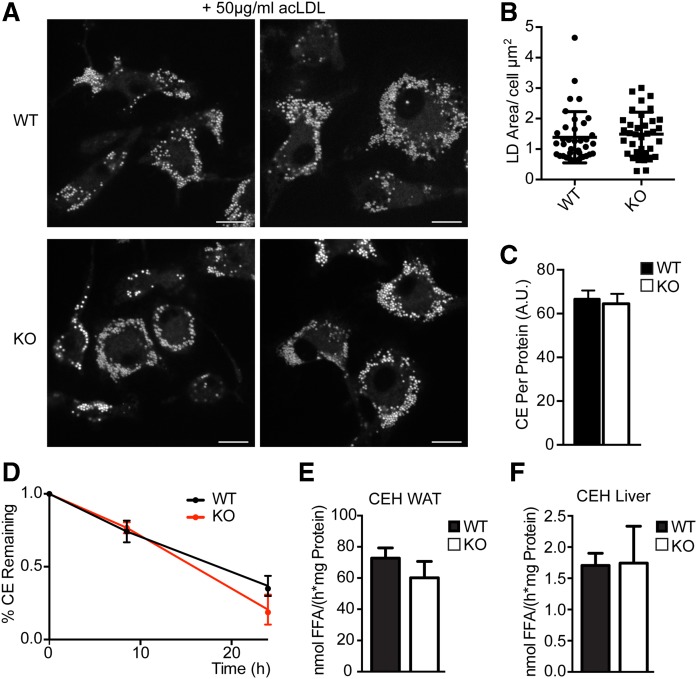
Variations in the gene LDAH (C2ORF43), which encodes lipid droplet-associated hydrolase (LDAH), are among few loci associated with human prostate cancer. Homologs of LDAH have been identified as proteins of lipid droplets (LDs). LDs are cellular organelles that store neutral lipids, such as triacylglycerols and sterol esters, as precursors for membrane components and as reservoirs of metabolic energy. LDAH is reported to hydrolyze cholesterol esters and to be important in macrophage cholesterol ester metabolism. Here, we confirm that LDAH is localized to LDs in several model systems. We generated a murine model in which Ldah is disrupted but found no evidence for a major function of LDAH in cholesterol ester or triacylglycerol metabolism in vivo, nor a role in energy or glucose metabolism. Our data suggest that LDAH is not a major cholesterol ester hydrolase, and an alternative metabolic function may be responsible for its possible effect on development of prostate cancer.

Keywords: animal models; cholesterol efflux; lipase; lipoprotein metabolism; triglycerides.


Figures

Fig. 1.
Fig. 1.
LDAH homologs localize to LDs with a hydrophobic hairpin. A: The Drosophila homolog of LDAH has the purification profile of a LD protein. Normalized purification factors of different organelle markers across a cellular fractionation are plotted. HSL is the LD marker; protein disulfide isomerase is the ER marker; alcohol dehydrogenase is the cytosolic marker; lamin is the nuclear marker. B, C: LDAH localizes to LDs or to the ER in the absence of LDs. B: mCherry-tagged LDAH colocalizes with ADRP in HeLa cells in the presence of LDs. Cells were transfected with constructs and treated with 0.5 mM oleic acid overnight. Representative images are shown. Scale bar, 10 μm. C: GFP-tagged LDAH localized to the ER in the absence of LDs. Cells were transfected with constructs and imaged the next day. Representative images are shown. Scale bar, 10 μm. D, E: A hydrophobic hairpin motif localizes LDAH to LDs. D: A hydrophobic segment comprising amino acids 160–195 of Drosophila CG9186/LDAH is predicted to have a hairpin structure and is responsible for LD binding. The α/β-hydrolase fold and the catalytic GxSxG-motif are indicated. α-Helices predicted by PSIPRED and JPred 4 are shown in pink. E: Full-length mCherry-tagged dLDAH and amino acids 152–201 of dLDAH localize to LDs after oleic acid treatment, while deletion of amino acids 157–200 results in ablation of LD binding. GFP-Sec61β was used to visualize the ER. Cells were transfected with constructs and treated with 1 mM oleic acid overnight. LDs were stained with AUTOdot (blue). Representative images are shown. Scale bar, 5 μm. F: LDAH overexpression does not affect cholesterol esterase, retinol esterase, or triacylglycerol hydrolysis activity. Nanomoles of free fatty acids (FFA) per (hour per milligram protein) ± SD. Values are means (n = 4). Activities were determined in lysates of WT HeLa or S2 cells and cells overexpressing the LDAH homologs using phospholipid-emulsified 3H-labeled lipids at neutral pH. S2 cells overexpressing HSL were used as a positive control. ALDH, alcohol dehydrogenase; PDI, protein disulfide isomerase
Fig. 2.
Fig. 2.
LDAH is absent in mice with a targeted gene-disruption allele. A: A gene knockout cassette disrupts exons 2 and 3 of the Ldah gene. B–E: Ldah mRNA and protein are absent in Ldah KO animals. Schematic of the Ldah gene locus and targeting cassette (Knockout Mouse Project). Genotype of animals was confirmed with SD30636, NeoF, and SD primers. B: Ldah mRNA is reduced to 50% of the gene product in heterozygous mice and absent in Ldah KO animals. Relative Ldah mRNA abundance ± SD in different tissues of Ldah WT (black bars), heterozygous (gray bars), and KO mice (white bars) determined by qPCR. Ldah values were normalized to the average of β-actin and cyclophilin. Values are means (n = 3–4). C: Western blots against LDAH in liver tissue from male and female Ldah WT and KO animals confirmed loss of LDAH protein. Tubulin was used as a loading control. D: LDAH protein is undetectable in tissues of male Ldah KO animals by Western blot. Low and high exposures are shown for tubulin. E: Mass spectrometry (MS) analysis confirmed absence of LDAH in Ldah KO animals. Peptides that were identified by MS for LDAH (top) or ATGL (bottom) in WT or Ldah KO animals are mapped to the protein sequence. For ATGL, peptides were identified in both WT and KO tissue across the length of the protein. For LDAH, no peptides were identified in KO animals, and peptides from various parts of the protein were detected in lysates from WT tissue. Data from WAT and livers of two animals per genotype were combined for the graph.
Fig. 3.
Fig. 3.
Histological analysis revealed no abnormalities in Ldah KO animals. A, B: Histology of tissues from animals fed a chow diet (A) or a HFD (B). A: Oil red O staining of liver and adrenal glands, and hematoxylin and eosin (H and E) staining of white adipose tissue (WAT) from 10- to 12-week-old Ldah wild-type or knockout animals fed a chow diet. B: Oil red O staining of livers after 4-week HFD feeding (top panel), and H and E staining of livers and WAT after 22 weeks on a HFD (bottom panels). Tissues are shown at a magnification of ×10.
Fig. 4.
Fig. 4.
Loss of LDAH does not affect body mass gain, body composition, glucose tolerance, or tissue lipid composition. Loss of LDAH does not affect body mass gain, glucose tolerance, or body composition on chow or HFD. A: Ldah KO mice gain body mass as WT animals on chow or HFD. Body mass (g) ± SD of Ldah WT (closed squares) and KO (open squares) animals on chow (black squares) or 4-week HFD (red squares). Values are means (n = 6–8). B: Body composition (g or %) ± SEM of Ldah WT (closed bars) and KO (open bars) animals on chow (black bars) or 4-week HFD (red bars). Values are means (n = 6–8). C: Blood glucose (mg/dl) ± SEM of Ldah WT (closed squares) and KO (open squares) animals on chow (black squares) or 4-week HFD (red squares) after oral glucose tolerance test. Values are means (n = 6–8). D: Body mass (g) ± SD of Ldah WT (black squares) and KO (gray squares) animals on 22-week HFD. Values are means (n = 6–9). E: Body composition (g or %) ± SEM of Ldah WT (black bars) and KO (gray bars) animals on 22-week HFD. Values are means (n = 6–9). F, G: Lipid composition of livers after 22 weeks on HFD is not affected by loss of LDAH. F: CEs and TGs in liver lysates separated by TLC and stained by cerium molybdate as described [Krahmer et al., 2011 (34)]. G: Fold-change of lipid classes ± SD in Ldah KO versus WT animals determined by MS. Values are means (n = 4).
Fig. 5.
Fig. 5.
Loss of LDAH does not affect cholesterol ester (CE) turnover or hydrolysis. CE storage in bone marrow-derived macrophages was not affected by LDAH loss. Cells were treated with 50 µg/ml AcLDL for 18 h before imaging or lipid extraction. A: Representative images are shown. LDs were stained with BODIPY. Scale bar, 10 μm. B: LD area per cell (µm2). Values are means, and individual data points are plotted (n > 30). C: CEs per protein determined by thin-layer chromatography. D: LDAH does not play a role in cholesterol ester turnover in bone marrow-derived macrophages. Percentage CEs ± SD remaining. Values are means (n = 3). E, F: LDAH deficiency does not affect cholesterol esterase activity. CE hydrolase activity in white adipose tissue (WAT) and liver of Ldah WT (black bars) and KO mice (white bars). Activities were determined in the 20,000 g infranatant using phospholipid-emulsified 14C-labeled cholesterol oleate at neutral pH. E: Nanomoles of free fatty acids (FFA) per (hours per milligram protein) ± SD in WAT of Ldah WT (black bars) or KO mice (white bars). Values are means (n = 5). F: Nanomoles of FFA per (hours per milligrams protein) ± SD in livers of Ldah WT (black bars) or KO mice (white bars). Values are means (n = 7–8). CEH, cholesterol ester hydrolase.

References

    1. Hashemi H. F., and Goodman J. M.. 2015. The life cycle of lipid droplets. Curr. Opin. Cell Biol. 33: 119–124. - PMC - PubMed
    1. Krahmer N., Farese R. V. Jr., and Walther T. C.. 2013. Balancing the fat: lipid droplets and human disease. EMBO Mol. Med. 5: 973–983. - PMC - PubMed
    1. Straub B. K., Herpel E., Singer S., Zimbelmann R., Breuhahn K., Macher-Goeppinger S., Warth A., Lehmann-Koch J., Longerich T., Heid H., et al. 2010. Lipid droplet-associated PAT-proteins show frequent and differential expression in neoplastic steatogenesis. Mod. Pathol. 23: 480–492. - PubMed
    1. Hager M. H., Solomon K. R., and Freeman M. R.. 2006. The role of cholesterol in prostate cancer. Curr. Opin. Clin. Nutr. Metab. Care. 9: 379–385. - PubMed
    1. Schlaepfer I. R., Rider L., Rodrigues L. U., Gijón M. A., Pac C. T., Romero L., Cimic A., Sirintrapun S. J., Glodé L. M., Eckel R. H., et al. 2014. Lipid catabolism via CPT1 as a therapeutic target for prostate cancer. Mol. Cancer Ther. 13: 2361–2371. - PMC - PubMed

Publication types