. 2016 Nov 11:20:2331216516669329.
doi: 10.1177/2331216516669329.

Perception of Sung Speech in Bimodal Cochlear Implant Users

Affiliations

Perception of Sung Speech in Bimodal Cochlear Implant Users

Joseph D Crew et al. Trends Hear. .

Abstract

Combined use of a hearing aid (HA) and cochlear implant (CI) has been shown to improve CI users' speech and music performance. However, different hearing devices, test stimuli, and listening tasks may interact and obscure bimodal benefits. In this study, speech and music perception were measured in bimodal listeners for CI-only, HA-only, and CI + HA conditions, using the Sung Speech Corpus, a database of monosyllabic words produced at different fundamental frequencies. Sentence recognition was measured using sung speech in which pitch was held constant or varied across words, as well as for spoken speech. Melodic contour identification (MCI) was measured using sung speech in which the words were held constant or varied across notes. Results showed that sentence recognition was poorer with sung speech relative to spoken, with little difference between sung speech with a constant or variable pitch; mean performance was better with CI-only relative to HA-only, and best with CI + HA. MCI performance was better with constant words versus variable words; mean performance was better with HA-only than with CI-only and was best with CI + HA. Relative to CI-only, a strong bimodal benefit was observed for speech and music perception. Relative to the better ear, bimodal benefits remained strong for sentence recognition but were marginal for MCI. While variations in pitch and timbre may negatively affect CI users' speech and music perception, bimodal listening may partially compensate for these deficits.

Keywords: atypical speech; bimodal perception; cochlear implants; electro-acoustic stimulation; pitch perception.


Figures

Figure 1.
Figure 1.
HA (aided; green symbols) and unaided warble-tone thresholds (white symbols) measured in sound field (dB HL). The shaded area shows the maximum range of F0 for the sung speak stimuli, from 110 Hz to 220 Hz.
Figure 2.
Figure 2.
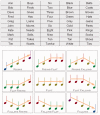
Top panel: Matrix sentence test stimuli and response screen. Bottom panel: MCI test stimuli and response screen.
Figure 3.
Figure 3.
Example spectrograms and electrodograms for stimuli used for speech testing; the same sentence was used for all panels. Spoken speech is shown in the top row, sung speech with Constant Pitch is shown in the middle row, and sung speech with Variable Pitch is shown in the bottom row. The left column shows full-band spectrograms, the middle column shows spectrograms with a HA simulation (steeply sloping hearing loss beyond 500 Hz), and the right column shows electrodograms generated using default stimulation parameters for Cochlear Corporation devices. For all panels, the x-axis shows time. For the spectrograms, the y-axis shows frequency in kHz; for the electrodograms, the y-axis shows electrode number from most apical (22) to most basal (1).
Figure 4.
Figure 4.
Example spectrograms and electrodograms for stimuli used for music testing. A rising melodic contour with three-semitone spacing is shown for the Constant Timbre (top row) and Variable Timbre conditions (bottom row). The left column shows full-band spectrograms, the middle column shows spectrograms with a HA simulation (steeply sloping hearing loss beyond 500 Hz), and the right column shows electrodograms generated using default stimulation parameters for Cochlear Corporation devices. For all panels, the x-axis shows time. For the spectrograms, the y-axis shows frequency in kHz; for the electrodograms, the y-axis shows electrode number from most apical (22) to most basal (1).
Figure 5.
Figure 5.
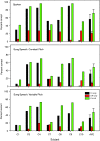
Individual and mean sentence recognition for Spoken (top panel), Constant Pitch (middle panel), and Variable Pitch (bottom panel) speech with the CI-only (black bars), the HA-only (red bars), and the CI + HA (green bars). For mean performance across subjects, the error bars indicate the standard error.
Figure 6.
Figure 6.
Individual and mean MCI performance for Constant (top panel) and Variable Timbre stimuli with the CI-only (black bars), the HA-only (red bars), and the CI + HA (green bars). For mean performance across subjects, the error bars indicate the standard error.
Figure 7.
Figure 7.
Mean bimodal benefit (across subjects) relative to performance with the CI-only (black bars) or to the better ear (gray bars) for speech and music perception.

References

    1. Allen E. J., Oxenham A. J. (2014) Symmetric interactions and interference between pitch and timbre. The Journal of the Acoustical Society of America 135: 1371–1379. - PMC - PubMed
    1. Armstrong M., Pegg P., James C., Blamey P. (1997) Speech perception in noise with implant and hearing aid. American Journal of Otolaryngology 18: S140–S141. - PubMed
    1. Brown C. A., Bacon S. P. (2009) Achieving electric-acoustic benefit with a modulated tone. Ear and Hearing 30: 489–493. - PMC - PubMed
    1. Chang Y.-P., Fu Q.-J. (2006) Effects of talker variability on vowel recognition in cochlear implants. Journal of Speech Language and Hearing Research 49: 1331–1341. - PubMed
    1. Crew J. D., Galvin J. J., 3rd, Fu Q.-J. (2012) Channel interaction limits melodic pitch perception in simulated cochlear implants. The Journal of the Acoustical Society of America 132: EL429–EL435. - PMC - PubMed

LinkOut - more resources