. 2017 Jan;173(1):642-654.
doi: 10.1104/pp.16.01603. Epub 2016 Nov 11.

DNA Topoisomerase Iα Affects the Floral Transition

Affiliations

DNA Topoisomerase Iα Affects the Floral Transition

Ximing Gong et al. Plant Physiol. 2017 Jan.

Abstract

DNA topoisomerases modulate DNA topology to maintain chromosome superstructure and genome integrity, which is indispensable for DNA replication and RNA transcription. Their function in plant development still remains largely unknown. Here, we report a hitherto unidentified role of Topoisomerase Iα (TOP1α) in controlling flowering time in Arabidopsis (Arabidopsis thaliana). Loss of function of TOP1α results in early flowering under both long and short days. This is attributed mainly to a decrease in the expression of a central flowering repressor, FLOWERING LOCUS C (FLC), and its close homologs, MADS AFFECTING FLOWERING4 (MAF4) and MAF5, during the floral transition. TOP1α physically binds to the genomic regions of FLC, MAF4, and MAF5 and promotes the association of RNA polymerase II complexes to their transcriptional start sites. These correlate with the changes in histone modifications but do not directly affect nucleosome occupancy at these loci. Our results suggest that TOP1α mediates DNA topology to facilitate the recruitment of RNA polymerase II at FLC, MAF4, and MAF5 in conjunction with histone modifications, thus facilitating the expression of these key flowering repressors to prevent precocious flowering in Arabidopsis.


Figures

Figure 1.
Figure 1.
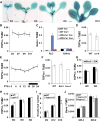
TOP1α controls flowering time in Arabidopsis. A, Schematic diagram showing the gene structure of TOP1α and the location of T-DNA insertion sites in top1α-10 (SALK_013164) and top1α-7 (SALK_112625). Exons and untranslated regions are represented by black and gray boxes, respectively, while introns and other genomic sequences are indicated by black lines. The translation start site (ATG) and stop codon (TGA) are indicated. B, Detection of N- and C-terminal transcripts of TOP1α in top1α-10 and top1α-7 mutants by semiquantitative reverse transcription PCR using the primer pairs indicated in A. TUBULIN2 (TUB2) was amplified as a control. C to E, top1α mutants flower much earlier than wild-type (WT) plants of the same age under both long-day and short-day conditions. C, A representative image shows that the top1α-10 mutant displays an early-flowering phenotype and is rescued by gTOP1α-4HA under long days. D and E, Quantitative comparison of rosette leaf number between wild-type plants and top1α mutants under both long days (D) and short days (E). Values were scored from 30 plants of each genotype. Error bars indicate sd of three biological repeats. Asterisks indicate statistically significant differences in the flowering time of top1α mutants compared with that of wild-type plants (two-tailed paired Student’s t test, P < 0.001).
Figure 2.
Figure 2.
Expression analysis of TOP1α during the floral transition. A, GUS staining of a representative gTOP1α-GUS line at the vegetative phase (3 and 6 d old) and during the floral transition (8 and 10 d old). Bars = 1 mm. B, Temporal expression of TOP1α in developing wild-type seedlings (5–11 d old) grown under long days. C, TOP1α expression is not affected by vernalization. Seeds were sown on Murashige and Skoog medium and vernalized at 4°C under low-light conditions for 8 weeks. The 9-d-old seedlings grown under long days were harvested for expression analysis. FLC expression was analyzed as a control for vernalization treatment. D, TOP1α expression is not altered in the CO mutant co-9. Expression analysis was performed on 9-d-old wild-type (WT) and co-9 seedlings grown under long days. E, TOP1α expression does not exhibit a circadian rhythm. Diurnal oscillation of TOP1α expression is shown in 9-d-old wild-type seedlings under long days. Samples were harvested at 4-h intervals over a 24-h period. Sampling time is expressed in hours as Zeitgeber time (ZT), which is the number of hours after the onset of illumination. F, TOP1α expression is not affected by the autonomous pathway. Expression analysis was performed on 9-d-old wild-type, fld-3, and fve-4 seedlings grown under long days. G, Effect of GA treatment on TOP1α expression in wild-type plants grown under short days. Exogenous GA (100 µm) or 0.1% ethanol (Mock) was applied weekly onto wild-type plants grown under short days. Seedlings treated from week 2 (W2) to week 3 (W3) were collected for expression analysis. H, Comparison of TOP1α expression in the GA-deficient mutant ga1-3 and wild-type plants. Seedlings grown under short days from week 2 (W2) to week 4 (W4) were collected for expression analysis. I, Comparison of rosette leaf number in developing wild-type and top1α-10 seedlings (9–18 d old) grown under long days. Values were scored from 30 plants of each genotype. Asterisks indicate statistically significant differences in leaf number of top1α-10 plants compared with that of wild-type plants (two-tailed paired Student’s t test, P < 0.001). J, Expression of SPL3 and SPL9 is not altered in 9-d-old top1α mutants versus wild-type plants grown under long days. Gene expression in B to H and J was determined by quantitative real-time PCR and normalized to TUB2 expression. Error bars indicate sd.
Figure 3.
Figure 3.
Elevated FLC expression suppresses the early-flowering phenotype of top1α-10. A to H, Temporal expression of SOC1 (A), FT (B), FLC (C), MAF1 (D), MAF2 (E), MAF3 (F), MAF4 (G), and MAF5 (H) in developing wild-type (WT) and top1α-10 seedlings grown under long days as determined by quantitative real-time PCR. The levels of gene expression normalized to TUB2 expression are shown as relative values to the maximal expression level set at 100%. Error bars indicate sd. Asterisks indicate statistically significant differences in gene expression between wild-type and top1α plants (two-tailed paired Student’s t test, P < 0.001). I, Comparison of rosette leaf number of various mutants or transgenic plants grown under long days. Values were scored from 30 plants of each genotype. Error bars indicate sd of three biological repeats. Asterisks indicate statistically significant differences in flowering time of the indicated plant pairs (two-tailed paired Student’s t test, P < 0.001). J, Relative FLC expression in 9-d-old seedlings of various genetic backgrounds grown under long days. The levels of FLC expression normalized to TUB2 expression are shown as relative values to the maximal expression level set at 100%. Asterisks indicate statistically significant differences in FLC expression in the indicated plant pairs (two-tailed paired Student’s t test, P < 0.001). Error bars indicate sd.
Figure 4.
Figure 4.
TOP1α binds physically to FLC and MAF genomic regions. A, Expression of TOP1α-4HA fusion proteins in top1α-10 gTOP1α-4HA examined by western-blot analysis using anti-HA antibody. Expression of histone H3 was used as an internal control. B, Schematic diagrams show the genomic regions of FLC, MAF4, and MAF5. Exons and untranslated regions are represented by black and gray boxes, respectively, while introns and other genomic regions are represented by black lines. Translation start sites and stop codons are indicated. DNA fragments amplified in ChIP assays are labeled beneath the genomic regions. C and D, ChIP analysis of TOP1α-4HA binding to FLC (C) and MAF (D) genomic regions in 9-d-old wild-type (WT) and top1α-10 gTOP1α-4HA seedlings. ChIP enrichment using anti-HA antibody was compared with enrichment without anti-HA antibody. Asterisks indicate statistically significant differences in ChIP enrichment between wild-type and top1α-10 gTOP1α-4HA seedlings (two-tailed paired Student’s t test, P < 0.001). Error bars indicate sd.
Figure 5.
Figure 5.
TOP1α promotes the association of RNA polymerase II complexes to FLC and MAF4/5 loci. A, Expression of RNA polymerase II (indicated by the largest subunit, NRPB1) in 9-d-old wild-type (WT) and top1α-10 seedlings detected by western-blot analysis using anti-RNA polymerase II (Pol II) CTD antibody. Expression of histone H3 was used as an internal control. B and C, ChIP assays show a reduced association of RNA polymerase II complexes with the regions flanking the transcription start sites of FLC (B) and MAF4/5 (C) in top1α-10 versus wild-type seedlings. ChIP enrichment using anti-RNA polymerase II CTD antibody was compared with enrichment without the antibody. Asterisks indicate statistically significant differences in ChIP enrichment between wild-type and top1α-10 seedlings (two-tailed paired Student’s t test, P < 0.05). Error bars indicate sd.
Figure 6.
Figure 6.
TOP1α affects histone modifications at FLC and MAF4/5 loci. A and B, ChIP analysis of H3K27me3 levels at FLC (A) and MAF4/5 (B) loci in 9-d-old wild-type (WT) and top1α-10 seedlings. Asterisks indicate statistically significant differences in ChIP enrichment between wild-type and top1α-10 seedlings (two-tailed paired Student’s t test, P < 0.05). Error bars indicate sd. C, ChIP analysis of H3K9/14ac levels at the FLC locus in 9-d-old seedlings. MU and ACT7 were used as negative and positive controls, respectively. Asterisks indicate statistically significant differences in ChIP enrichment in the plants of each indicated group (two-tailed paired Student’s t test, P < 0.05). Error bars indicate sd.
Figure 7.
Figure 7.
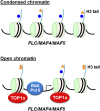
Model of the TOP1α role in controlling the floral transition. In the absence of TOP1α, the condensed chromatin at FLC, MAF4, and MAF5 loci prevents the recruitment of RNA polymerase II, which is associated with increased H3K27me3 but decreased H3K9/14ac modifications. This suppresses the expression of these flowering repressors, thus derepressing the floral transition. In wild-type plants, TOP1α binds to FLC, MAF4, and MAF5 loci and removes DNA helical tension to create an open chromatin at these loci. These changes facilitate the recruitment of RNA polymerase II (Pol II), which correlates with decreased H3K27me3 but increased H3K9/14ac modifications, thus promoting the expression of these flowering repressors to prevent precocious flowering. Blue circles represent H3K27me3, and orange triangles represent H3K9/14ac.

Similar articles

Cited by

References

    1. Amasino R. (2004) Vernalization, competence, and the epigenetic memory of winter. Plant Cell 16: 2553–2559 - PMC - PubMed
    1. Andersson CR, Helliwell CA, Bagnall DJ, Hughes TP, Finnegan EJ, Peacock WJ, Dennis ES (2008) The FLX gene of Arabidopsis is required for FRI-dependent activation of FLC expression. Plant Cell Physiol 49: 191–200 - PubMed
    1. Ashour ME, Atteya R, El-Khamisy SF (2015) Topoisomerase-mediated chromosomal break repair: an emerging player in many games. Nat Rev Cancer 15: 137–151 - PubMed
    1. Ausín I, Alonso-Blanco C, Jarillo JA, Ruiz-García L, Martínez-Zapater JM (2004) Regulation of flowering time by FVE, a retinoblastoma-associated protein. Nat Genet 36: 162–166 - PubMed
    1. Buzas DM, Robertson M, Finnegan EJ, Helliwell CA (2011) Transcription-dependence of histone H3 lysine 27 trimethylation at the Arabidopsis polycomb target gene FLC. Plant J 65: 872–881 - PubMed

Publication types

MeSH terms

LinkOut - more resources