

The Arabidopsis Polycomb Repressive Complex 1 (PRC1) Components AtBMI1A, B, and C Impact Gene Networks throughout All Stages of Plant Development
- PMID: 27837089
- PMCID: PMC5210725
- DOI: 10.1104/pp.16.01259
The Arabidopsis Polycomb Repressive Complex 1 (PRC1) Components AtBMI1A, B, and C Impact Gene Networks throughout All Stages of Plant Development
Abstract
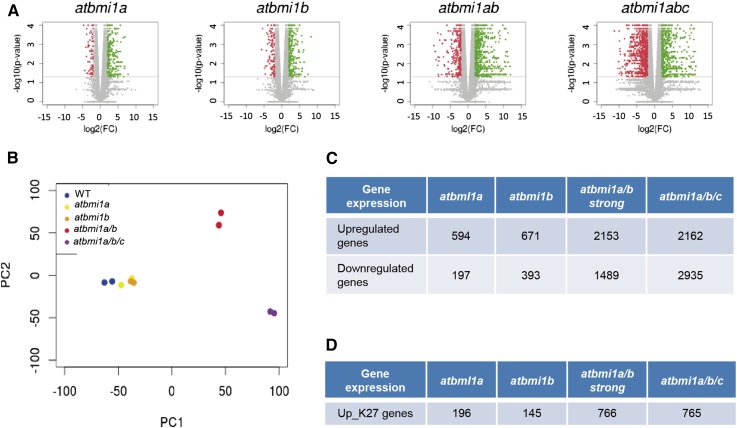
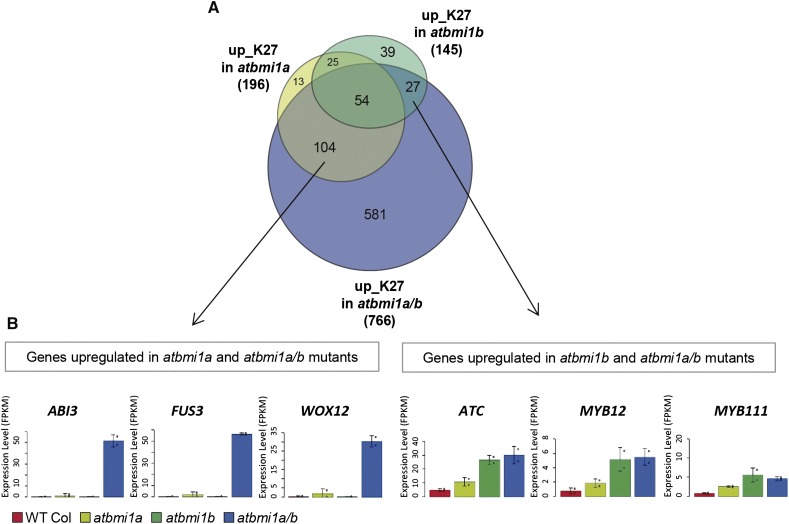
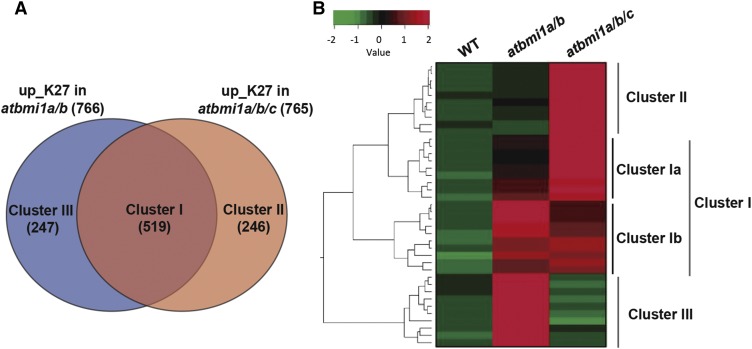
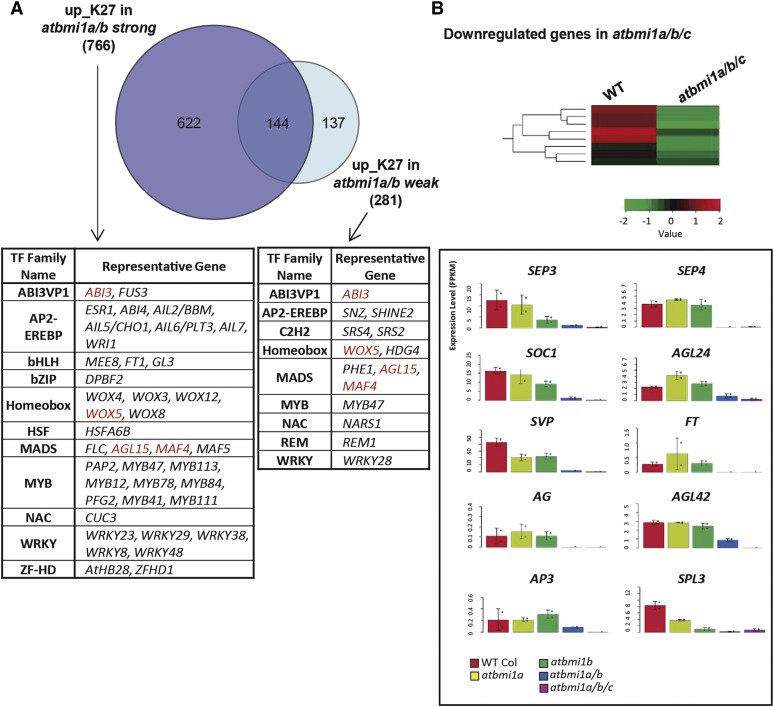
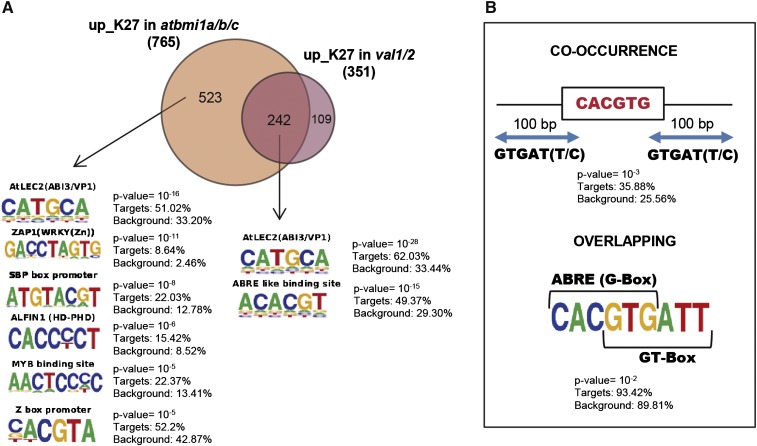
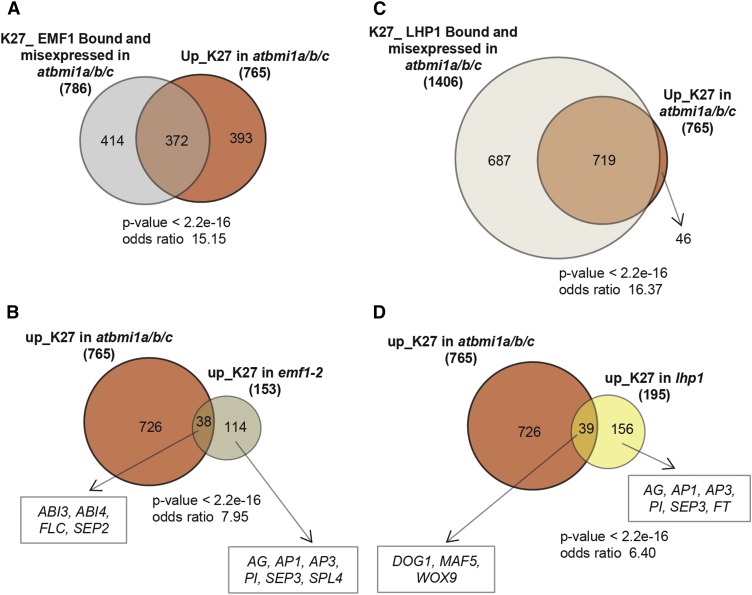
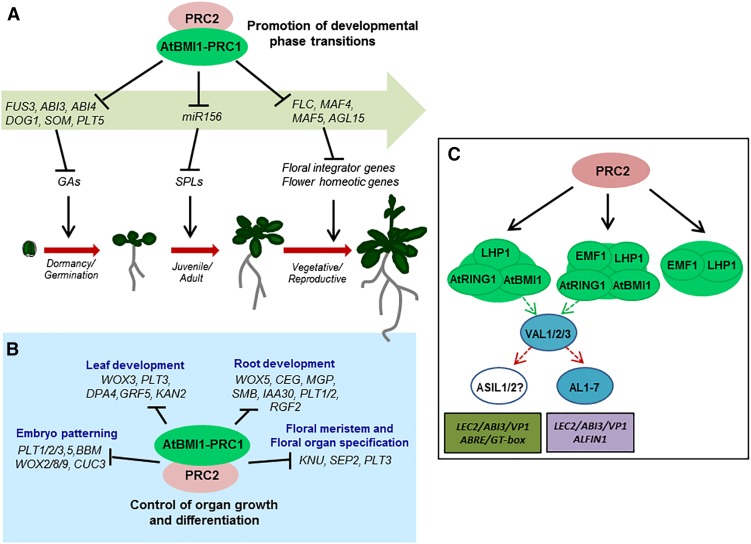
Polycomb Group regulation in Arabidopsis (Arabidopsis thaliana) is required to maintain cell differentiation and allow developmental phase transitions. This is achieved by the activity of three PcG repressive complex 2s (PRC2s) and the participation of a yet poorly defined PRC1. Previous results showed that apparent PRC1 components perform discrete roles during plant development, suggesting the existence of PRC1 variants; however, it is not clear in how many processes these components participate. We show that AtBMI1 proteins are required to promote all developmental phase transitions and to control cell proliferation during organ growth and development, expanding their proposed range of action. While AtBMI1 function during germination is closely linked to B3 domain transcription factors VAL1/2 possibly in combination with GT-box binding factors, other AtBMI1 regulatory networks require participation of different factor combinations. Conversely, EMF1 and LHP1 bind many H3K27me3 positive genes up-regulated in atbmi1a/b/c mutants; however, loss of their function affects expression of a different subset, suggesting that even if EMF1, LHP1, and AtBMI1 exist in a common PRC1 variant, their role in repression depends on the functional context.
© 2017 American Society of Plant Biologists. All Rights Reserved.
Figures
Similar articles
-
H2A monoubiquitination in Arabidopsis thaliana is generally independent of LHP1 and PRC2 activity.Genome Biol. 2017 Apr 12;18(1):69. doi: 10.1186/s13059-017-1197-z. Genome Biol. 2017. PMID: 28403905 Free PMC article.
-
Arabidopsis AL PHD-PRC1 complexes promote seed germination through H3K4me3-to-H3K27me3 chromatin state switch in repression of seed developmental genes.PLoS Genet. 2014 Jan;10(1):e1004091. doi: 10.1371/journal.pgen.1004091. Epub 2014 Jan 23. PLoS Genet. 2014. PMID: 24465219 Free PMC article.
-
ZRF1 Chromatin Regulators Have Polycomb Silencing and Independent Roles in Development.Plant Physiol. 2016 Nov;172(3):1746-1759. doi: 10.1104/pp.16.00193. Epub 2016 Sep 14. Plant Physiol. 2016. PMID: 27630184 Free PMC article.
-
PRC1 is taking the lead in PcG repression.Plant J. 2015 Jul;83(1):110-20. doi: 10.1111/tpj.12818. Epub 2015 Mar 20. Plant J. 2015. PMID: 25754661 Review.
-
Chromatin modulation and gene regulation in plants: insight about PRC1 function.Biochem Soc Trans. 2018 Aug 20;46(4):957-966. doi: 10.1042/BST20170576. Epub 2018 Jul 31. Biochem Soc Trans. 2018. PMID: 30065110 Review.
Cited by
-
The plant stem-cell niche and pluripotency: 15 years of an epigenetic perspective.Front Plant Sci. 2022 Oct 31;13:1018559. doi: 10.3389/fpls.2022.1018559. eCollection 2022. Front Plant Sci. 2022. PMID: 36388540 Free PMC article.
-
PcG Proteins MSI1 and BMI1 Function Upstream of miR156 to Regulate Aerial Tuber Formation in Potato.Plant Physiol. 2020 Jan;182(1):185-203. doi: 10.1104/pp.19.00416. Epub 2019 Aug 19. Plant Physiol. 2020. PMID: 31427464 Free PMC article.
-
LEAFY COTYLEDONs: old genes with new roles beyond seed development.F1000Res. 2019 Dec 27;8:F1000 Faculty Rev-2144. doi: 10.12688/f1000research.21180.1. eCollection 2019. F1000Res. 2019. PMID: 31942235 Free PMC article. Review.
-
Removal of H2Aub1 by ubiquitin-specific proteases 12 and 13 is required for stable Polycomb-mediated gene repression in Arabidopsis.Genome Biol. 2020 Jun 16;21(1):144. doi: 10.1186/s13059-020-02062-8. Genome Biol. 2020. PMID: 32546254 Free PMC article.
-
Molecular and epigenetic regulations and functions of the LAFL transcriptional regulators that control seed development.Plant Reprod. 2018 Sep;31(3):291-307. doi: 10.1007/s00497-018-0337-2. Epub 2018 May 24. Plant Reprod. 2018. PMID: 29797091 Review.
References
-
- Bratzel F, López-Torrejón G, Koch M, Del Pozo JC, Calonje M (2010) Keeping cell identity in Arabidopsis requires PRC1 RING-finger homologs that catalyze H2A monoubiquitination. Curr Biol 20: 1853–1859 - PubMed
-
- Bratzel F, Yang C, Angelova A, López-Torrejón G, Koch M, del Pozo JC, Calonje M (2012) Regulation of the new Arabidopsis imprinted gene AtBMI1C requires the interplay of different epigenetic mechanisms. Mol Plant 5: 260–269 - PubMed
-
- Calonje M. (2014) PRC1 marks the difference in plant PcG repression. Mol Plant 7: 459–471 - PubMed
Publication types
MeSH terms
Substances
LinkOut - more resources
Full Text Sources
Other Literature Sources
Molecular Biology Databases
Miscellaneous
