. 2017 Jan:115:1-13.
doi: 10.1016/j.phrs.2016.10.031. Epub 2016 Nov 9.

Transcriptome profiling of NIH3T3 cell lines expressing opsin and the P23H opsin mutant identifies candidate drugs for the treatment of retinitis pigmentosa

Affiliations

Transcriptome profiling of NIH3T3 cell lines expressing opsin and the P23H opsin mutant identifies candidate drugs for the treatment of retinitis pigmentosa

Yuanyuan Chen et al. Pharmacol Res. 2017 Jan.

Abstract

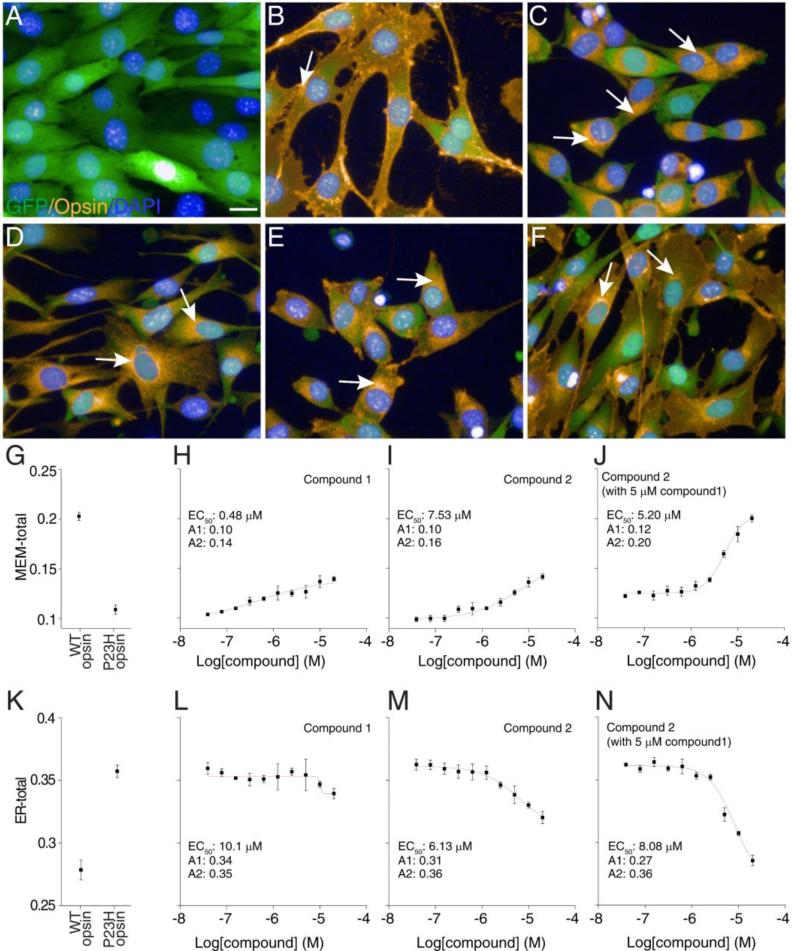
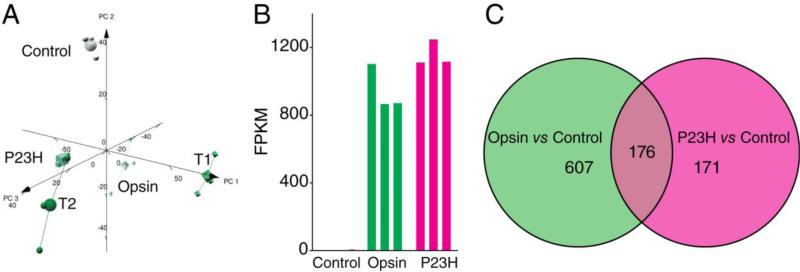
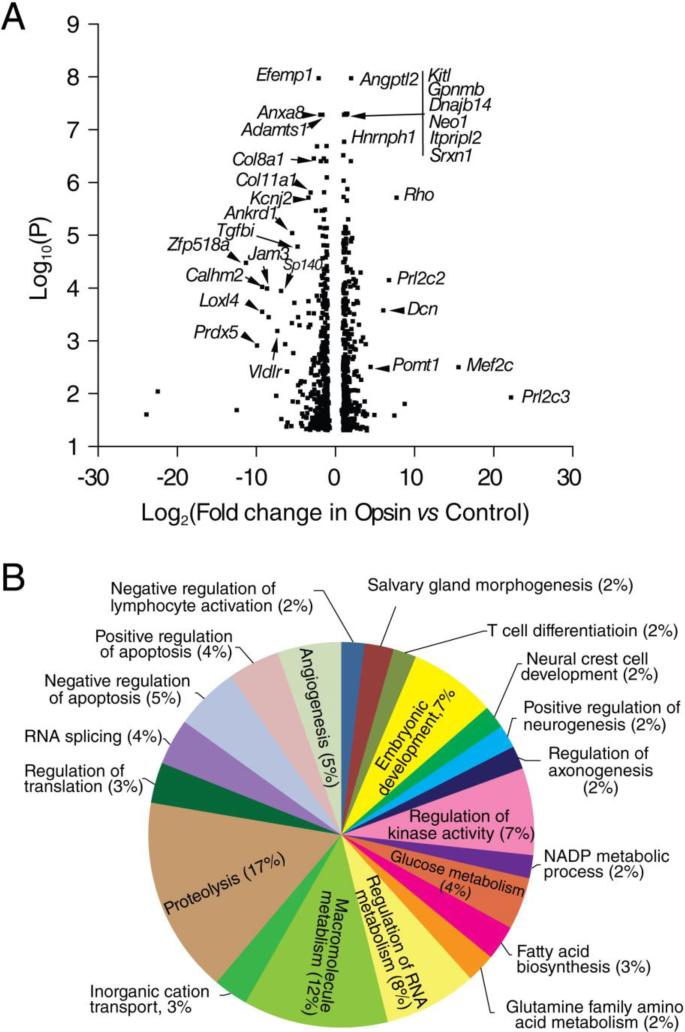
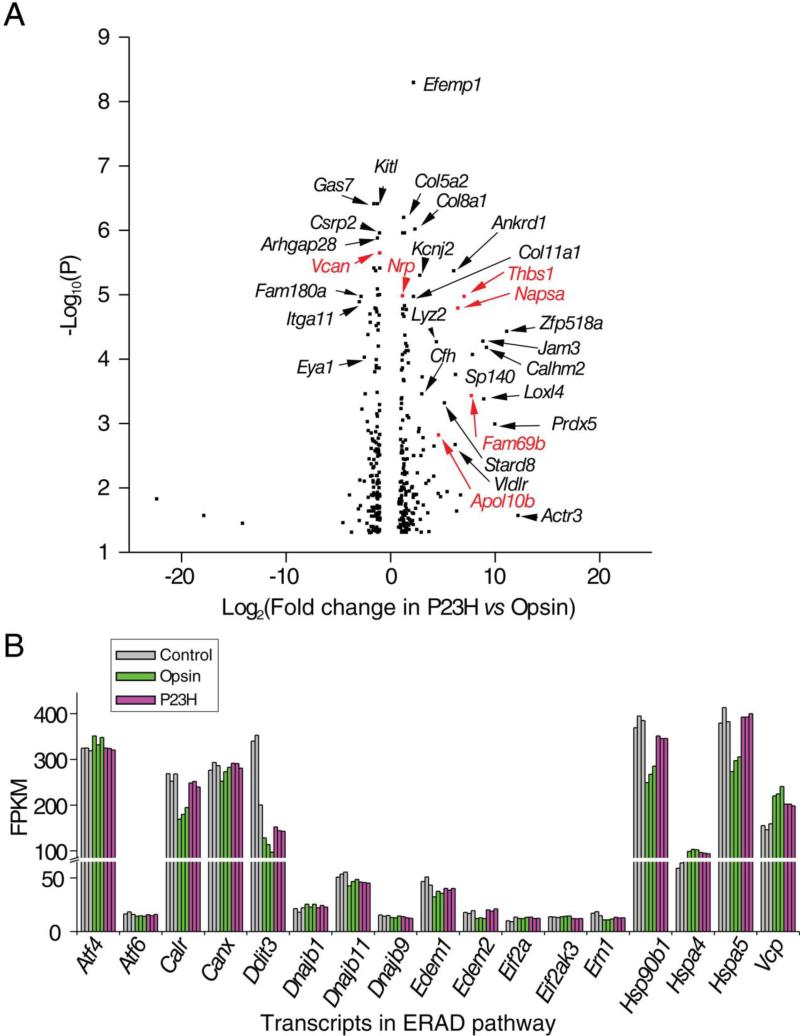
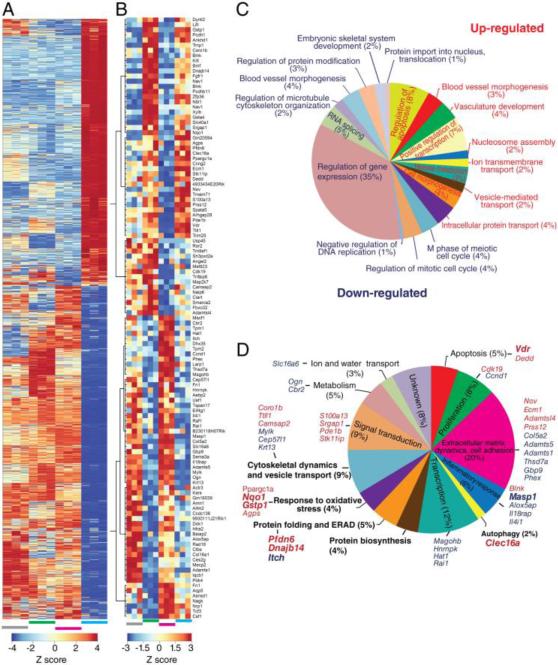
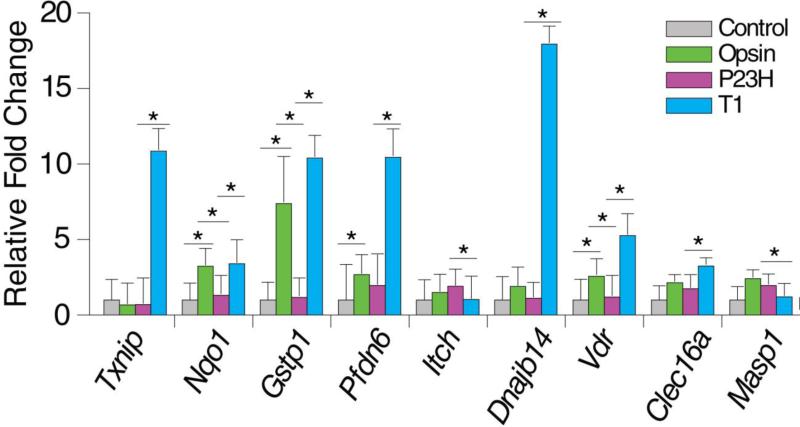
Mammalian cells are commonly employed in screening assays to identify active compounds that could potentially affect the progression of different human diseases including retinitis pigmentosa (RP), a class of inherited diseases causing retinal degeneration with compromised vision. Using transcriptome analysis, we compared NIH3T3 cells expressing wildtype (WT) rod opsin with a retinal disease-causing single P23H mutation. Surprisingly, heterologous expression of WT opsin in NIH3T3 cells caused more than a 2-fold change in 783 out of 16,888 protein coding transcripts. The perturbed genes encoded extracellular matrix proteins, growth factors, cytoskeleton proteins, glycoproteins and metalloproteases involved in cell adhesion, morphology and migration. A different set of 347 transcripts was either up- or down-regulated when the P23H mutant opsin was expressed suggesting an altered molecular perturbation compared to WT opsin. Transcriptome perturbations elicited by drug candidates aimed at mitigating the effects of the mutant protein revealed that different drugs targeted distinct molecular pathways that resulted in a similar phenotype selected by a cell-based high-throughput screen. Thus, transcriptome profiling can provide essential information about the therapeutic potential of a candidate drug to restore normal gene expression in pathological conditions.

Keywords: Cell-based HTS; Drug discovery; P23H opsin; RNA-seq; Retina; Retinitis pigmentosa; Rhodopsin; Transcriptome.


Figures

Figure 1
Figure 1
Immunofluorescence and image analysis of NIH3T3 cells expressing GFP and opsins. Panel A, only GFP was expressed; panel B, WT opsin and GFP were co-expressed; panels C-F, P23H opsin mutant and GFP were co-expressed; GFP, Cy3 labeling associated with 1D4 anti-rhodopsin antibodies and nuclei stained with DAPI are shown in green, yellow, and blue, respectively. Cells were treated with 0.05% DMSO in A-C; 5 μM of compound 1 in D; 10 μM of compound 2 in E; and 5 μM compound 1 plus 10 μM of compound 2 in F. Arrows in B-F indicate opsin (WT or P23H) staining in the ER region. Scale bar, 20 μm. Quantification of opsin on the plasma membrane (G) and in the ER region (K) by image based analysis. Unlike WT opsin stained on the cell boundary, the P23H opsin mutant accumulated in the perinuclear region of NIH3T3 cells. Treatment with compound 1 reduced the perinuclear accumulation of P23H opsin, whereas treatment with compound 2 induced a significant amount of plasma membrane staining of P23H opsin. Co-treatment with both compounds 1 and 2 demonstrated a synergistic rescue of P23H opsin transport to the plasma membrane. For image analysis, the cytoplasm was defined by GFP fluorescence whereas the nucleus was defined by DAPI fluorescence. The MEM-total was calculated as the mean ratio of Cy3 intensity on the plasma membrane region to that in the entire cell. The ER-total was calculated as the mean ratio of Cy3 intensity in the perinuclear region to that in the entire cell. NIH3T3 cells expressing P23H or WT opsin were treated with 0.1% DMSO as controls (G and K). NIH3T3 cells expressing the P23H opsin were treated with compound 1 (H and L), compound 2 (I and M) or compound 2 with 5 μM compound 1 (J and N); each compound was tested in 10 concentrations starting at 20 μM and followed by 2-fold dilutions. Data points and error bars represent averages and standard deviations of biological replicates.
Figure 2
Figure 2
Transcriptome overview of NIH3T3 cells expressing GFP and opsin under different treatment conditions: Control, only GFP was expressed; Opsin, opsin and GFP were co-expressed; P23H, P23H opsin mutant and GFP were co-expressed. Cells were treated with 0.05% DMSO as a vehicle control. T1 or T2, the P23H opsin and GFP expressing cells were treated with 5 μM of compound 1 or 10 μM of compound 2, respectively. A. Principle component analysis plot of the five sample groups. B. FPKM reads of Rho transcripts from three NIH3T3 stable cell lines revealed similar heterologous expression levels of WT opsin or the P23H opsin mutant in each cell line. Each sample group contained three biological replicates. C. Comparison of differential expression (DE) profiles of Opsin versus Control and P23H versus Control. The two circles represent each of the two DE profiles. The number of transcripts located in both DE profiles is shown in the overlapping area of the two circles, whereas the number of transcripts detected in only one DE profile is placed in the corresponding circle. The DE filter was set for fold changes of more than 2 and an FDR smaller than 5%.
Figure 3
Figure 3
Transcriptome changes in NIH3T3 cells from heterologous expression of mouse opsin. Control, NIH3T3 cells expressing only GFP; Opsin, NIH3T3 cells expressing both opsin and GFP. A. Volcano plot of transcripts which showed DE in Opsin versus Control. P values are plotted in a −log10 format as y-values, and fold changes of FPKM reads in P23H versus Opsin are plotted in a Log2 format as x-values. Representative transcripts that showed significant differential expression are labeled with gene names. B. Pie chart showing biological processes (BP) enriched in the DE profile of Opsin versus Control. The size of each pie is correlated with number of genes included in the corresponding BP as a percentage of the total number of genes counted in all BPs.
Figure 4
Figure 4
Transcriptome differences between NIH3T3 cells expressing the P23H opsin mutant versus those expressing WT opsin. Control, NIH3T3 cells expressing only GFP; P23H, NIH3T3 cells expressing both the P23H opsin mutant and GFP; Opsin, NIH3T3 cells expressing both opsin and GFP. A. Volcano plot of transcripts which showed DE in P23H versus Opsin. P values are plotted in a −log10 format as y-values, and fold changes of FPKM reads in P23H versus Opsin are plotted in a Log2 format as x-values. Representative transcripts that showed DE in P23H versus Opsin but not in P23H versus Control are in black print, suggesting loss-of-opsin-properties in the P23H opsin mutant. Those that showed DE in both P23H versus Opsin and P23H versus Control are indicated in red, suggesting gain-of-abnormal-properties in the P23H opsin. B. FPKM reads of transcripts in the endoplasmic reticulum associated protein degradation (ERAD) pathway of the three stable cell lines. The results suggest no significant activation of this pathway due to expression of WT or P23H opsin. Each sample group had three biological replicates.
Figure 5
Figure 5
Transcriptome shift of NIH3T3 cells expressing P23H opsin and GFP upon treatment with compound 1 (T1 versus P23H). A. Heat map of transcripts showing DE in T1 versus P23H. Four sample groups are shown, each with three biological replicates: grey bar, Control - NIH3T3 cells expressing only GFP; green bar, Opsin - NIH3T3 cells expressing both opsin and GFP; magenta bar, P23H - NIH3T3 cells expressing both P23H opsin mutant and GFP; blue bar, T1 - NIH3T3 cells expressing both P23H opsin mutant and GFP that were treated with 5 μM of compound 1. The heat map legend is displayed at the bottom. B. Heat map of transcripts in DE of T1 versus P23H that were reversed as compared to their changes in DE of P23H versus Opsin. C. Pie chart of biological processes (BP) which were enriched with up-regulated genes are denoted in red and BPs associated with down-regulated genes are denoted in blue. Numbers of genes changed in each BP are shown as a percentage of the total gene number of all BPs represented by the size of the corresponding pie. D. Pie chart of BPs enriched among the 117 genes that were reversed in DE of T1 versus P23H compared to their changes in P23H versus Opsin. The percentage numbers in parenthesis following each BP represent the percentage of transcripts among the 117 genes classified in that BP. Gene names of the top 25 up- and down-regulated transcripts are labeled at the side of each BP. BPs that are most relevant to opsin biosynthesis are labeled in bold. Transcripts that were selected and confirmed by qPCR assay were labeled in bold.
Figure 6
Figure 6
Fold changes of 9 transcripts in NIH3T3 cells expressing GFP only (Control, grey), Opsin and GFP (Opsin, green), or P23H opsin and GFP treated with DMSO (P23H, magenta) or compound 1 (DMSO), quantified by qPCR. Fold changes of transcripts were first normalized by Gapdh as a control transcript, and then compared to Control in the qPCR assay. The fold change of each transcript was averaged from three biological replicates, and error bars show the standard deviations of those replicates. * indicates a P value smaller than 0.05. Transcriptional regulation of the 9 transcripts by T1 was in agreement with what was found by RNA-seq.

Similar articles

Cited by

References

    1. Boland MR, Jacunski A, Lorberbaum T, Romano JD, Moskovitch R, Tatonetti NP. Systems biology approaches for identifying adverse drug reactions and elucidating their underlying biological mechanisms. Wiley interdisciplinary reviews. Systems biology and medicine. 2015 - PMC - PubMed
    1. Westerhoff HV, Nakayama S, Mondeel TD, Barberis M. Systems Pharmacology: An opinion on how to turn the impossible into grand challenges. Drug discovery today. Technologies. 2015;15:23–31. - PubMed
    1. Daiger SP, Sullivan LS, Bowne SJ. Genes and mutations causing retinitis pigmentosa. Clinical genetics. 2013;84(2):132–41. - PMC - PubMed
    1. Ratnapriya R, Swaroop A. Genetic architecture of retinal and macular degenerative diseases: the promise and challenges of next-generation sequencing. Genome Med. 2013;5(10):84. - PMC - PubMed
    1. LaVail MM, Yasumura D, Matthes MT, Yang H, Hauswirth WW, Deng WT, Vollrath D. Gene Therapy for MERTK-Associated Retinal Degenerations. Advances in experimental medicine and biology. 2016;854:487–93. - PMC - PubMed

Publication types