. 2017 Jan;205(1):303-316.
doi: 10.1534/genetics.116.189209. Epub 2016 Nov 11.

Complex Ancient Genetic Structure and Cultural Transitions in Southern African Populations

Affiliations

Complex Ancient Genetic Structure and Cultural Transitions in Southern African Populations

Francesco Montinaro et al. Genetics. 2017 Jan.

Abstract

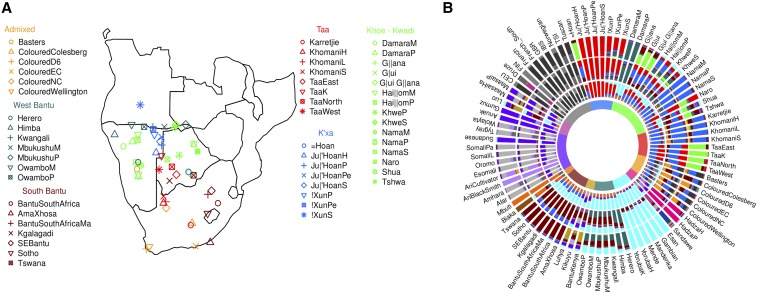
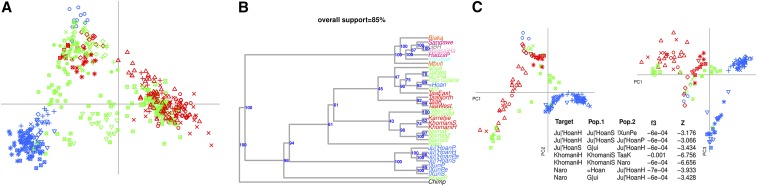
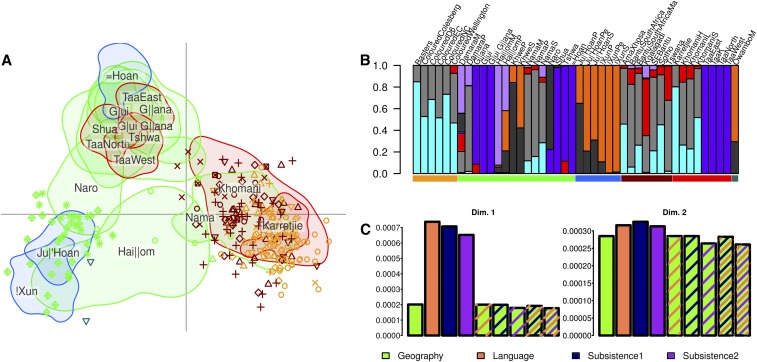
The characterization of the structure of southern African populations has been the subject of numerous genetic, medical, linguistic, archaeological, and anthropological investigations. Current diversity in the subcontinent is the result of complex events of genetic admixture and cultural contact between early inhabitants and migrants that arrived in the region over the last 2000 years. Here, we analyze 1856 individuals from 91 populations, comprising novel and published genotype data, to characterize the genetic ancestry profiles of 631 individuals from 51 southern African populations. Combining both local ancestry and allele frequency based analyses, we identify a tripartite, ancient, Khoesan-related genetic structure. This structure correlates neither with linguistic affiliation nor subsistence strategy, but with geography, revealing the importance of isolation-by-distance dynamics in the area. Fine-mapping of these components in southern African populations reveals admixture and cultural reversion involving several Khoesan groups, and highlights that Bantu speakers and Coloured individuals have different mixtures of these ancient ancestries.

Keywords: African prehistory; Khoesan; ancient structure; sub-Saharan Africa.


Figures

Figure 1
Figure 1
The genetic structure of southern Africa populations. (A) Southern Africa populations analyzed in this study. Different Colours are associated with different language/ethnic affiliation. The complete dataset used for analysis is shown in Figure S1 and Table S1. (B) Admixture results for K=10,15,20 (from the inner to the outer circle). Colours at the center reflect the affiliation shown at (A) and Figure S1. We analyzed 1856 individuals for 91 populations, and averaged the results in a population based barplot. The full set of results (K={1..20}) for individuals and populations is reported in Figure S2 and Figure S3.
Figure 2
Figure 2
Local ancestry deconvolution reveals complex Khoesan-related structure. (A) MDS of Khoesan specific fragments. We extracted fragments with high (>99%) probability to be derived from Khoesan populations, and visualized it in a MDS plot, as described in the section Materials and Methods. (B) ML tree of Khoesan populations. We selected all the Khoesan populations, and added seven African and European populations. We performed 10 different runs and assessed the support of each tree through 100 bootstraps (Figure S6). Colour keys are as in Figure 1A and Figure S1. (C) PCA of individuals with >80% of Khoesan-related genetic ancestry. We used the K = 3 ADMIXTURE run to select individuals characterized by at least 80% of Khoesan genetic ancestry, and performed a PCA as described in the section, Materials and Methods. The two most significant f3 between “Target” and sources (“Pop.1” and “Pop.2”) populations, including SD and Z-score, are reported.
Figure 3
Figure 3
(A) Genetic structure of admixed southern African populations. In order to provide a simplified version of Figure 2A, we estimated the 90% utilization kernel of Khoesan populations (except Damara and Khwe, see text), and plotted the highly admixed individuals. (B) Cluster analysis of genomic fragments. We grouped all the individuals in seven clusters, as inferred by Mclust R package (see Materials and Methods), and visualized the results in barplots according to populations and language/ethnic affiliation. Colour keys are as in Figure 1A and Figure S1. The results highlight the large heterogeneity in populations sharing the same affiliation, and the existence of a slight but significant substructure between Bantu and Coloured populations. (C) Predictive errors of genetic components for geographic, linguistic, and subsistence affiliation, or a combination of different covariates (striped bars), for the first two dimensions of the MDS in Figure 2 and (A) (Dim 1 and Dim 2, respectively). Geography better predicts genetic ancestries, though adding new covariates slightly decreases the predictive error.

References

    1. Alexander D. H., Novembre J., Lange K., 2009. Fast model-based estimation of ancestry in unrelated individuals. Genome Res. 19: 1655–1664. - PMC - PubMed
    1. Barbieri C., Butthof A., Bostoen K., Pakendorf B., 2013a Genetic perspectives on the origin of clicks in Bantu languages from southwestern Zambia. Eur. J. Hum. Genet. 21: 430–436. - PMC - PubMed
    1. Barbieri C., Vicente M., Rocha J., Mpoloka S. W., Stoneking M., et al. , 2013b Ancient substructure in early mtDNA lineages of southern Africa. Am. J. Hum. Genet. 92: 285–292. - PMC - PubMed
    1. Barham L., Mitchell P., 2008. The First Africans: African Archaeology from the Earliest Toolmakers to Most Recent Foragers. Cambridge University Press, Cambridge, UK.
    1. Barnard A., 1992. Hunters and Herders of Southern Africa: A Comparative Ethnography of the Khoisan Peoples. Cambridge University Press, Cambridge, UK.

LinkOut - more resources