

Investigating trends in asthma and COPD through multiple data sources: A small area study
- PMID: 27839578
- PMCID: PMC5118221
- DOI: 10.1016/j.sste.2016.05.004
Investigating trends in asthma and COPD through multiple data sources: A small area study
Abstract
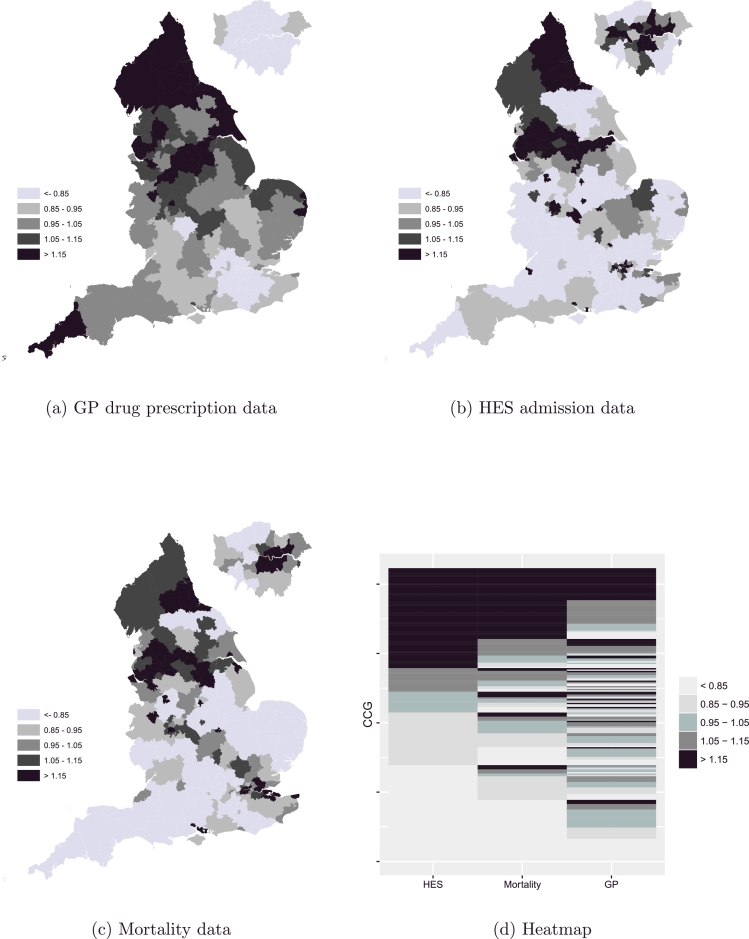
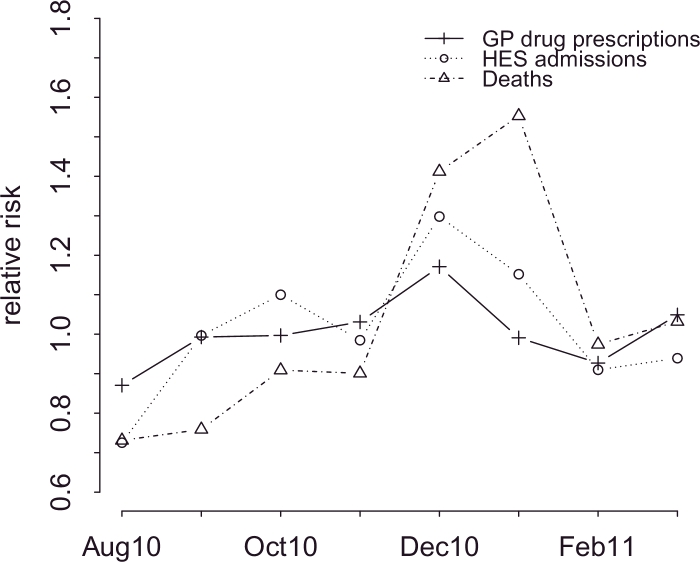
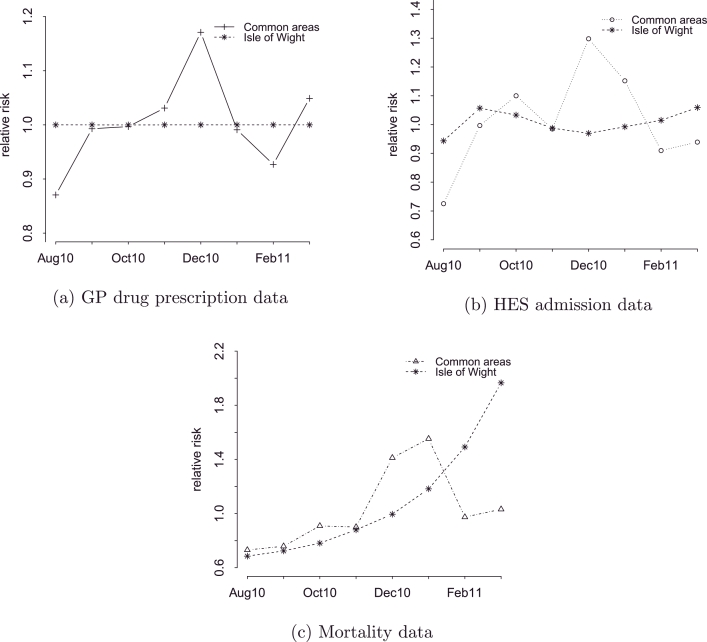
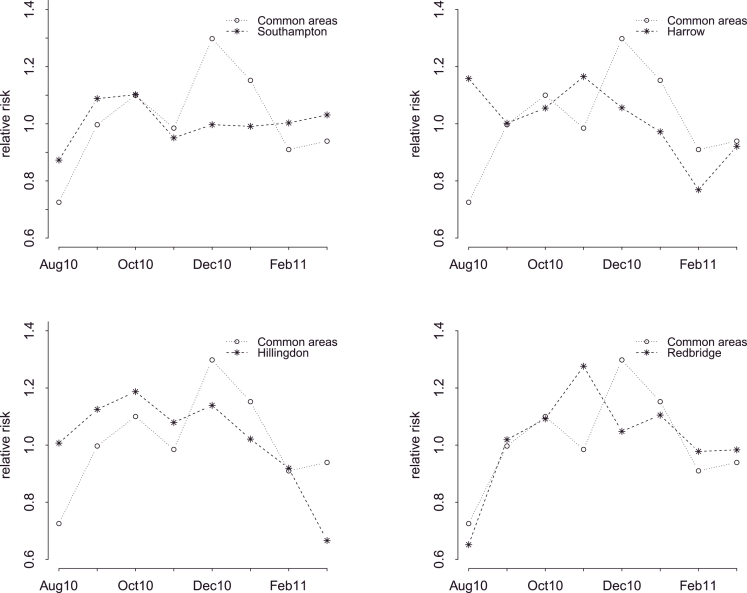
This paper investigates trends in asthma and COPD by using multiple data sources to help understanding the relationships between disease prevalence, morbidity and mortality. GP drug prescriptions, hospital admissions, and deaths are analysed at clinical commissioning group (CCG) level in England from August 2010 to March 2011. A Bayesian hierarchical model is used for the analysis, which takes into account the complex space and time dependencies of asthma and COPD, while it is also able to detect unusual areas. Main findings show important discrepancies across the different data sources, reflecting the different groups of patients that are represented. In addition, the detection mechanism that is provided by the model, together with inference on the spatial, and temporal variation, provide a better picture of the respiratory health problem.
Keywords: Asthma and COPD; Detection; Space-time analysis.
Copyright © 2016 The Authors. Published by Elsevier Ltd.. All rights reserved.
Figures
References
-
- Andersen Z.J., Hvidberg M., Jensen S.S., Ketzel M., Loft S., Sørensen M., Tjønneland A., Overvad K., Raaschou-Nielsen O. Chronic obstructive pulmonary disease and long-term exposure to traffic-related air pollution: a cohort study. Am J Respir Crit Care Med. 2011;183(4):455–461. - PubMed
-
- Bernardinelli L., Clayton D., Pascutto C., Montomoli C., Ghislandi M., Songini M. Bayesian analysis of space-time variation in disease risk. Stat Med. 1995;14(21–22):2433–2443. - PubMed
-
- Besag J. Spatial interaction and the statistical analysis of lattice systems. J R Stat Soc Ser B (Stat Methodol) 1974;36(2):192–236.
-
- Besag J., York J., Mollié A. Bayesian image restoration, with two applications in spatial statistics. Ann Inst Stat Math. 1991;43(1):1–20.
Publication types
MeSH terms
Grants and funding
LinkOut - more resources
Full Text Sources
Other Literature Sources
Medical
