. 2016 Nov 21;26(22):2981-2991.
doi: 10.1016/j.cub.2016.08.072. Epub 2016 Nov 10.

Live Monitoring of Blastemal Cell Contributions during Appendage Regeneration

Affiliations

Live Monitoring of Blastemal Cell Contributions during Appendage Regeneration

Valerie A Tornini et al. Curr Biol. .

Abstract

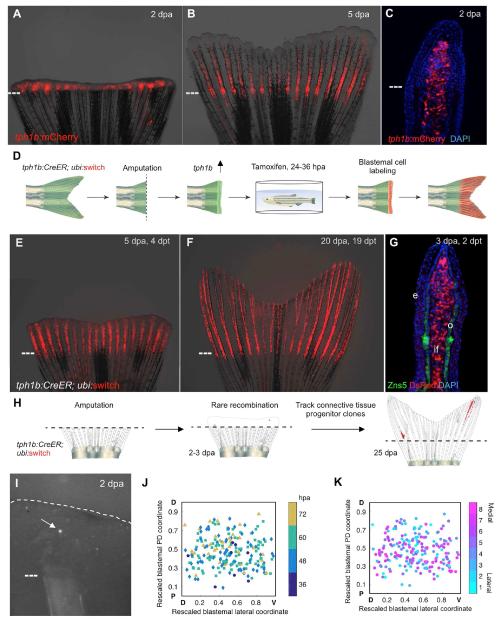
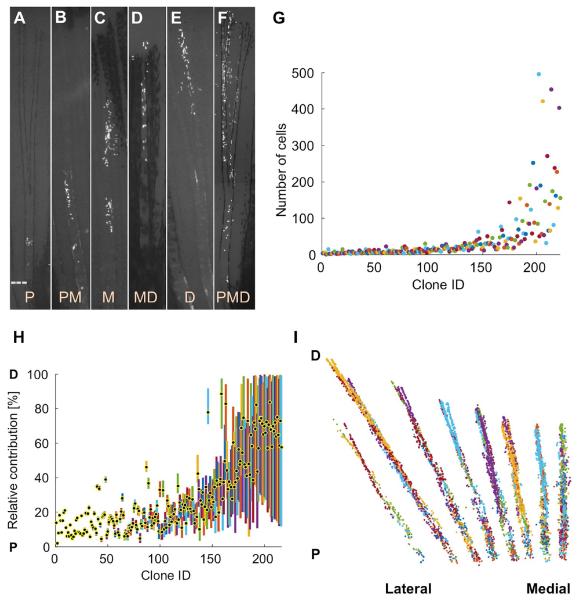
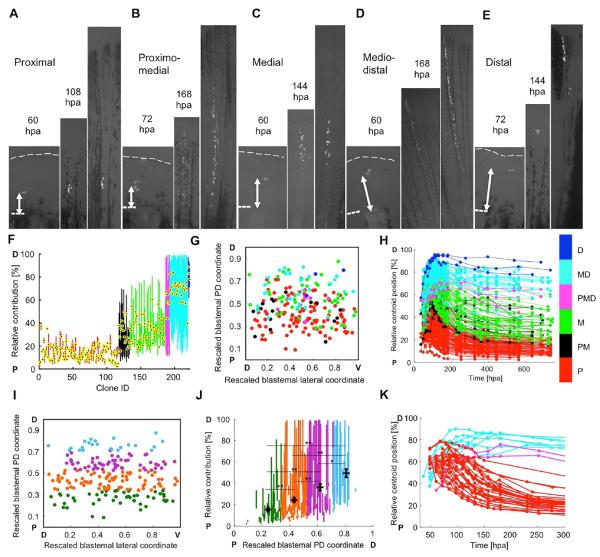
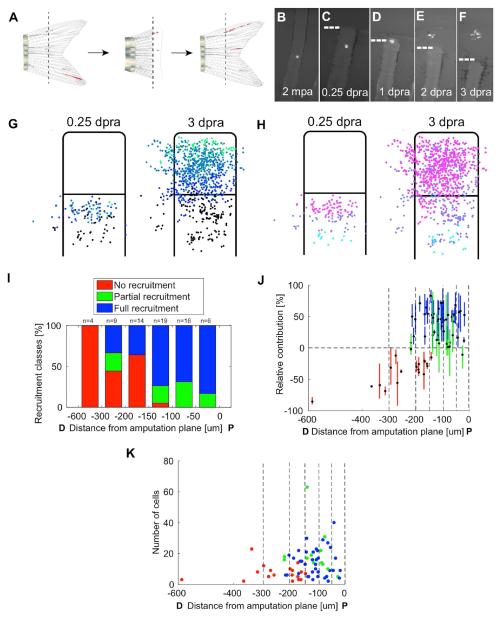
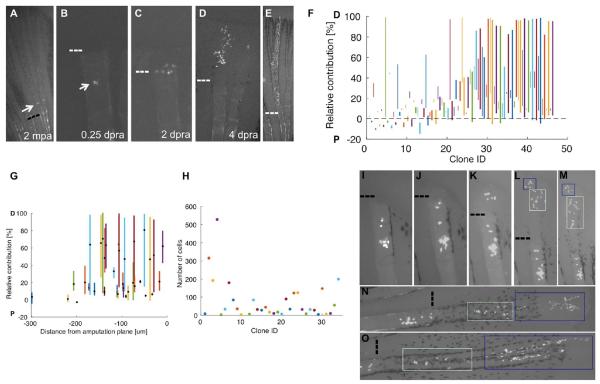
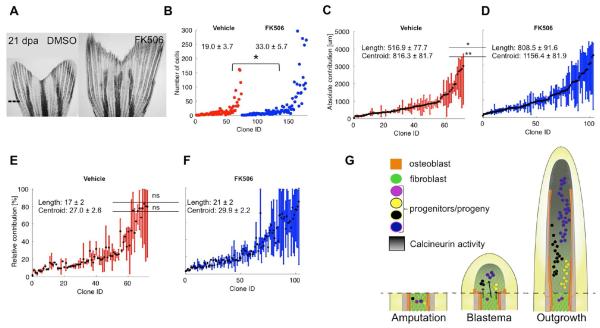
The blastema is a mass of progenitor cells that enables regeneration of amputated salamander limbs or fish fins. Methodology to label and track blastemal cell progeny has been deficient, restricting our understanding of appendage regeneration. Here, we created a system for clonal analysis and quantitative imaging of hundreds of blastemal cells and their respective progeny in living adult zebrafish undergoing fin regeneration. Amputation stimulates resident cells within a limited recruitment zone to reset proximodistal (PD) positional information and assemble the blastema. Within the newly formed blastema, the spatial coordinates of connective tissue progenitors are predictive of their ultimate contributions to regenerated skeletal structures, indicating early development of an approximate PD pre-pattern. Calcineurin regulates size recovery by controlling the average number of progeny divisions without disrupting this pre-pattern. Our longitudinal clonal analyses of regenerating zebrafish fins provide evidence that connective tissue progenitors are rapidly organized into a scalable blueprint of lost structures.

Keywords: appendage; blastema; clonal analysis; fibroblast; fin; positional identity; regeneration; tph1b; vertebrate; zebrafish.


Figures

Figure 1
Figure 1. tph1b Regulatory Sequences Permit Clonal Analysis of Blastemal Cells
(A and B) tph1b:mCherry reporter expression in regenerating fins at 2 (A) and 5 (B) days post amputation (dpa). (C) Section of tph1b:mCherry fin at 2 dpa. (D) Design of lineage tracing experiments in (E and F). (E and F) tph1b:CreER; ubi:switch fins were treated with 4 μM tamoxifen from 24-36 hours post amputation (hpa) and imaged at 5 (E) and 20 (F) dpa. (G) Section through 3 dpa lineage-labeled tph1b:CreER; ubi:switch fin, stained for osteoblasts (green) using the Zns5 antibody as well as nuclei (DAPI, blue). e, epidermis; o, osteoblasts, if, intraray fibroblasts. (H) Design of clonal analysis experiments in (I to K). (I) Representative image of a single labeled blastemal cell (arrow) in a 2 dpa blastema. (J) Two-D projection of all initial labeling events onto a rescaled virtual blastema, with rescaled lateral coordinates (D, dorsal; V, ventral) and initial PD coordinates (amputation plane, P, proximal; distal tip, D, distal), color-coded by time of detection of the initial labeling event. (K) Two-D projection of all initial labeling events onto a rescaled virtual blastema, color-coded by ray of origin (1 indicates lateral-most ray, 8 indicates the medial ray). Dashed lines, amputation planes. See also Figure S1.
Figure 2
Figure 2. Extreme Heterogeneity in Blastemal Cell Clone Size and PD Contribution
(A–F) Connective tissue clones initially labeled at 1.5-3 dpa and imaged at 28 dpf, showing examples of proximal (P; A), proximomedial (PM; B), medial (M; C), mediodistal (MD; D), and distal (D; E) clones, as well as clones spanning the PD axis (PMD; F). Dashed line, amputation plane. (G) Final number of cells in each clone. (H) Plot of the relative position along the PD axis in which the clone progeny are distributed, normalized for regenerated ray length (amputation plane to distal tip) as a percentage. The centroid position of each clone is indicated with a black and yellow dot. (I) Cumulative 2-D projection of 216 clones onto a virtual fin lobe at the final timepoint. P, proximal; D, distal. See also Figure S2, Table S1, and Movie S1.
Figure 3
Figure 3. Evidence that Blastema Connective Tissue Progenitors Assemble a PD Pre-Pattern
(A–E) Examples of clone expansion over time in hours post amputation (hpa), for proximal (A), proximomedial (B), medial (C), mediodistal (D), and distal (E) clones. The final image in each panel is the final timepoint, collected at 25-29 dpa. Dashed lines, amputation planes. (F) The relative positions of clones in Fig. 2G grouped and color-coded by final PD contribution, used for retrospective assessment of initial labeling position: proximal (red), proximomedial (black), medial (green), mediodistal (cyan), distal (blue), and spanning the PD axis (magenta). The centroid position of each clone is indicated with a black and yellow dot. (G) Two-dimensional projection of all initial labeling events onto a rescaled virtual blastema, with rescaled lateral (D, dorsal; V, ventral) and PD (P, proximal; D, distal) coordinates, color-coded by final PD occupancy as in (F). (H) The relative position of each clone in the regenerating ray over time, color-coded by PD contribution. Relative position is defined as the mean distance to the distal plane, divided by the mean distance from amputation plane to distal tip, multiplied by 100. (I) Two-dimensional projection of all initial labeling events onto a rescaled virtual blastema, grouped and color-coded by initial cell location in the blastema: 15-33.75% (green, bin 1), 33.75-52.5% (orange, bin 2), 52.5-71.25% (purple, bin 3), and 71.25-90% (light blue, bin 4). (J) Final relative position of each clone, including the mean calculated centroid. Clones are grouped and color-coded by their initial cell location in the blastema, as in (I). *P < 0.01, **P < 0.005; Mann-Whitney two-tailed test, n = 216 clones total; n = 47 (bin 1), n = 90 (bin 2), n = 56 (bin 3), and n = 23 (bin 4). (K) Cells initially labeled in the proximal half of the blastema that contribute to mediodistal regions, and cells initially labeled in the distal half of the blastema that contribute to proximal regenerate tissue, were identified and their relative centroid positions were plotted over time, color-coded by final PD contribution: proximal (red), mediodistal (cyan), and spanning the PD axis (magenta). Presence of these clones indicate a capacity to mix or non-conform to the pre-pattern. Dashed lines, amputation planes. See also Figure S3.
Figure 4
Figure 4. Recruitment Dynamics of Resident Cells during Blastema Formation
(A) Diagram of re-amputation experiment visualizing recruitment of labeled resident cells to form a new blastema and regenerated structures. (B–F) Re-amputation experiment visualizing recruitment of labeled cells to form a new blastema, shown at 2 months post initial amputation (mpa) (B), and 0.25 (C), 1 (D), 2 (E), and 3 days post re-amputation (dpra) (F). (G and H) Retrospective (G) and prospective (H) analyses of labeled cell recruitment following amputation injury, shown as cumulative 2-D projections of cells from 68 clones onto a rescaled virtual stump and blastema at 0.25 or 3 dpa, as indicated. For retrospective analyses, the clone centers of masses were binned by their relative positions at 3 dpra, color-coded from proximal (below the amputation plane) to distal (tip of blastema) as black, blue, light blue, and green (G). For prospective analyses, clones’ center of masses were binned by their relative positions at 0.25 dpra, color-coded from furthest to closest to amputation plane as cyan, purple, or magenta (H). Resident cells are recruited towards the injury site and proliferate to occupy most areas of the blastema. (I) Probabilities for recruitment to the blastema for clones binned by their initial distance (in μm) from the amputation plane. Cell contributions were categorized as fully recruited to the blastema with no progeny below the amputation plane (full recruitment, blue), progeny contributing both to the blastema and below the amputation plane (partial recruitment, green), or contribution to the blastema (no recruitment, red). Generally, cells near the amputation plane have a higher probability of contributing to the blastema, although the distance from amputation plane is not indicative of extent of contribution. (J) The relative contributions of progeny of below the amputation plane (below 0%) or to the blastema (above 0%) at 3 dpra, relative to the cells initial distance (in μm) from the amputation plane. Cell contributions are color-coded by full recruitment (blue), partial recruitment (green), or no recruitment (red). Clones were binned by their initial distance (in μm) from the amputation plane (vertical dashed lines). Cells generally have a higher probability of recruitment to the blastema if they are closer to the site of injury, although the distance from the amputation plane does not determine the extent or final PD position of their contributions. (K) The final number of cells in each clone generated by resident cells at 3 dpra, relative to the initial distance (in μm) of the resident cell from the amputation plane. Cell contributions are color-coded by full recruitment (blue), partial recruitment (green), or no recruitment (red). Clones were binned by their initial distance (in μm) from the amputation plane (vertical dashed lines). Cells that contribute to the blastema proliferate to different extents, with no evidence of a direct association with distance of the resident cell from the amputation plane. See also Figure S4, and Movies S2 and S3.
Figure 5
Figure 5. Amputation Resets the Positional Information of Resident Cells
(A–E) Re-amputation experiment visualizing recruitment of labeled resident cells to form a new blastema and regenerated structures, shown at 2 months post initial amputation (mpa), and 0 (A), 0.25 (B), 2 (C), 4 (D), and 28 days post re-amputation (dpra) (E). (F) Comparison of respective first and second clones’ relative PD contributions to regenerated ray lengths. Second clones’ relative contributions plotted as bold lines. Cells that had been part of established proximal clones could contribute to structures extending throughout the PD axis of the second regenerate. (G) Distance of the labeled cell proximal to the second amputation plane (in μm) plotted against the PD contribution of the resultant clone after the second amputation (in μm). Distance of recruited cells to the amputation plane does not directly correlate with final PD contribution to regenerate (linear regression, R = −0.2586, P = 0.0826). (H) Relative PD contribution and position of clone centroid (black dot) attributable to single resident cells after re-amputation, plotted by the distance of the cell (in μm) from the second amputation plane. Recruited cells varied in their relative contributions to the regenerate, and these contributions did not correlate with their distance from the amputation plane (linear regression, relative contribution R = 0.18, P = 0.298; centroid R = 0.25, P = 0.147). (I–O) Re-amputation experiment visualizing recruitment of labeled connective tissue cells from a P clone to form a new blastema, shown at 0.5 (I), 1 (J), 2 (K), 3 (L), 4 (M), 6 (N), and 9 (O) days post re-amputation (dpra). Blue and green boxes track progeny of cells from the 3 dpra blastema. Dashed lines, amputation planes. See also Figure S5.
Figure 6
Figure 6. Calcineurin Enhances Regeneration by Scaling Clone Size
(A) Representative images of 21 dpa tph1b:CreER; ubi:switch fins treated with vehicle (DMSO) or FK506 from 3 to 21 dpa. Dashed line, amputation plane. (B) Final numbers of cells in clones from vehicle- (red) or FK506-treated (blue) zebrafish at 21 dpa. *P < 0.05, Mann-Whitney one-tailed test, n = 73 (vehicle), n = 104 (FK506). (C and D) Absolute positions along the PD axis (in μm) indicating clone contributions, for clones from vehicle- (C) or FK506-treated (D) fish. The centroid position of each clone is indicated with a black dot. Clone length is significantly increased in clones from FK506-treated fish, *P < 0.05, Mann-Whitney one-tailed test, n = 73 (vehicle), n = 104 (FK506). Centroid position is significantly distalized in clones from FK506-treated fish, *P < 0.005, Mann-Whitney one-tailed test, n = 73 (vehicle), n = 104 (FK506). (E and F) Relative position of each clone, including the mean calculated centroid of clones from vehicle- (E) or FK506-treated (F) fish. Clone length and centroid positions are not significantly changed between the two groups, ns, not significant. (G) Model for blastemal proliferation dynamics. (Left) Cells are recruited to form the blastema from regions proximal to the amputation plane. (Middle) By 3 dpa, blastemal connective tissue progenitors establish preferences to contribute to distinct PD regions based on their coordinates. (Right) The connective tissue compartment regenerates from progenitors in the blastemal approximate pre-pattern. Calcineurin activity increases as regeneration proceeds (dark gradient) and progressively lowers proliferation of fibroblast progeny. Blocking Calcineurin activity with FK506 releases the brake on cell division and clone cell number, scaling up the size of regenerated skeletal elements. See also Figure S6.

Comment in

  • Regeneration: Recorded Live!
    Weidinger G. Weidinger G. Curr Biol. 2017 Jan 9;27(1):R30-R33. doi: 10.1016/j.cub.2016.11.022. Curr Biol. 2017. PMID: 28073020

References

    1. Tornini VA, Poss KD. Keeping at arm's length during regeneration. Developmental Cell. 2014;29:139–145. - PMC - PubMed
    1. Simon A, Tanaka EM. Limb regeneration. Wiley Interdiscip Rev Dev Biol. 2013;2:291–300. - PubMed
    1. Kragl M, Knapp D, Nacu E, Khattak S, Maden M, Epperlein HH, Tanaka EM. Cells keep a memory of their tissue origin during axolotl limb regeneration. Nature. 2009;460:60–65. - PubMed
    1. Rinkevich Y, Lindau P, Ueno H, Longaker MT, Weissman IL. Germ-layer and lineage-restricted stem/progenitors regenerate the mouse digit tip. Nature. 2011;476:409–413. - PMC - PubMed
    1. Knopf F, Hammond C, Chekuru A, Kurth T, Hans S, Weber CW, Mahatma G, Fisher S, Brand M, Schulte-Merker S, et al. Bone regenerates via dedifferentiation of osteoblasts in the zebrafish fin. Developmental Cell. 2011;20:713–724. - PubMed

Publication types

LinkOut - more resources