. 2017 Jan 5;20(1):56-69.
doi: 10.1016/j.stem.2016.09.010. Epub 2016 Nov 10.

Myogenic Progenitor Cells Control Extracellular Matrix Production by Fibroblasts during Skeletal Muscle Hypertrophy

Affiliations

Myogenic Progenitor Cells Control Extracellular Matrix Production by Fibroblasts during Skeletal Muscle Hypertrophy

Christopher S Fry et al. Cell Stem Cell. .

Abstract

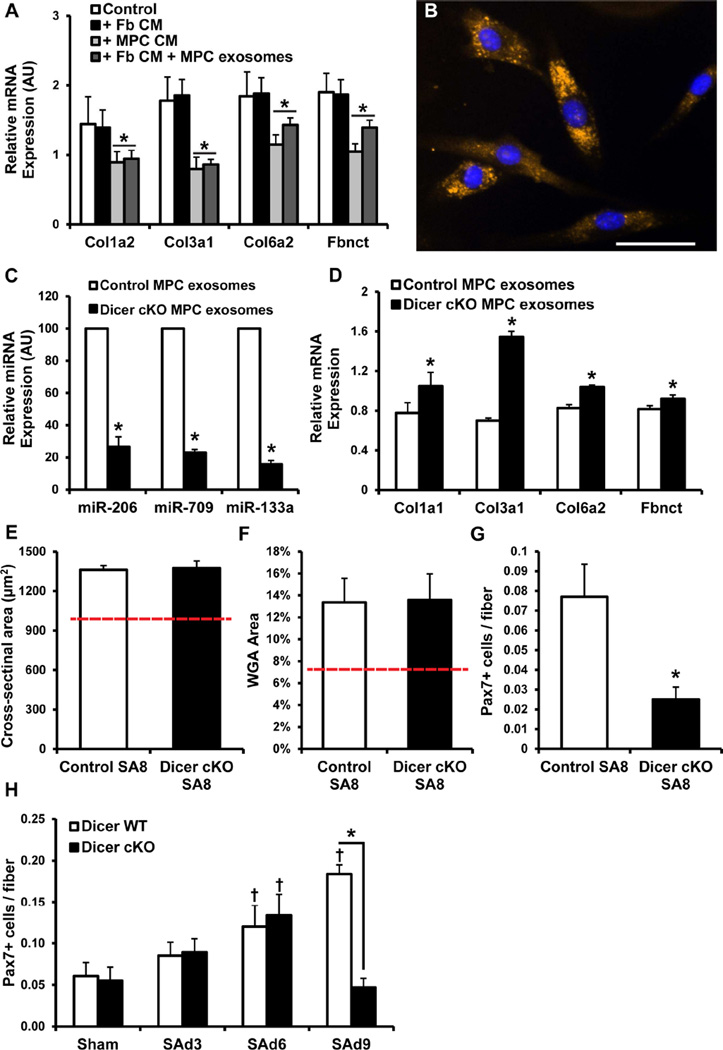
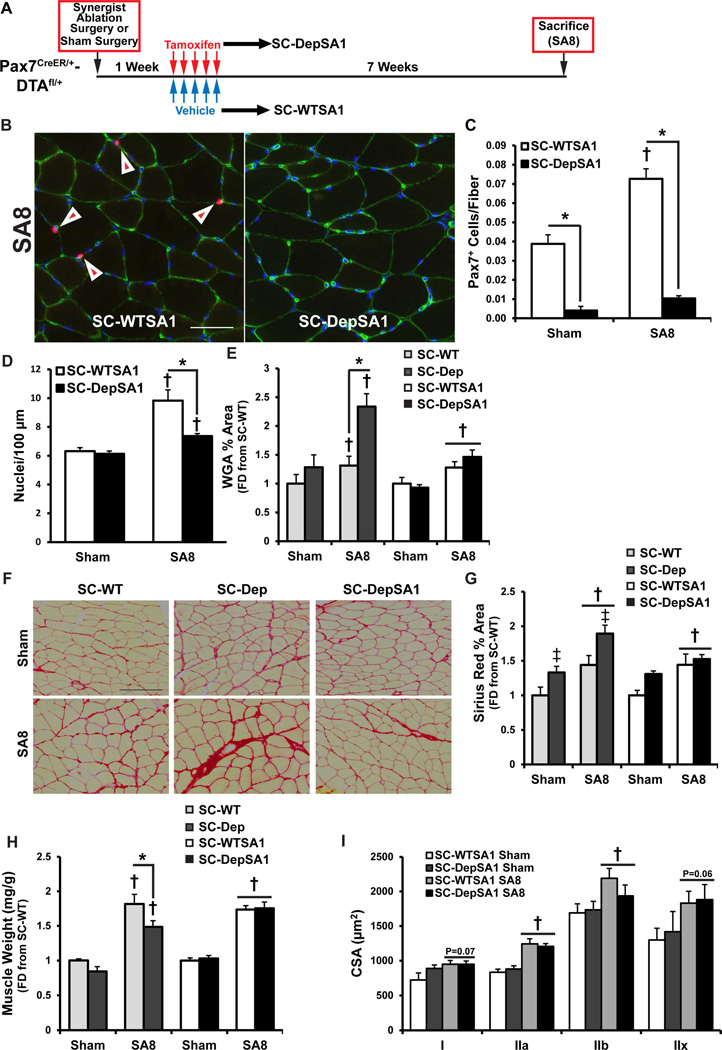
Satellite cells, the predominant stem cell population in adult skeletal muscle, are activated in response to hypertrophic stimuli and give rise to myogenic progenitor cells (MPCs) within the extracellular matrix (ECM) that surrounds myofibers. This ECM is composed largely of collagens secreted by interstitial fibrogenic cells, which influence satellite cell activity and muscle repair during hypertrophy and aging. Here we show that MPCs interact with interstitial fibrogenic cells to ensure proper ECM deposition and optimal muscle remodeling in response to hypertrophic stimuli. MPC-dependent ECM remodeling during the first week of a growth stimulus is sufficient to ensure long-term myofiber hypertrophy. MPCs secrete exosomes containing miR-206, which represses Rrbp1, a master regulator of collagen biosynthesis, in fibrogenic cells to prevent excessive ECM deposition. These findings provide insights into how skeletal stem and progenitor cells interact with other cell types to actively regulate their extracellular environments for tissue maintenance and adaptation.

Keywords: Pax7; collagen; exosomes; extracellular matrix; fibrosis; hypertrophy; microRNA; muscle; muscle progenitor cells; satellite cells.


Conflict of interest statement

The authors declare no conflicts of interest.

Figures

Figure 1
Figure 1. Depletion of satellite cells does not influence fibrogenic cell expansion or myofibroblast differentiation during the first two weeks of overload
A) Experimental schematic for conditional depletion of satellite cells using the Pax7-DTA mouse strain. Following tamoxifen or vehicle treatment and a two week washout, plantaris muscle was mechanically overloaded using synergist ablation for either one (SA1) or two (SA2) weeks. See also Figure S1 and S2A–B. Representative images of a SC-Dep muscle cross-section at SA1 illustrating immunohistochemical identification of (B) Tcf4+ (green); (C) α smooth muscle actin (αSMA) + (orange) cells. Blood vessels (white arrows) are strongly αSMA+, serving as a positive control. D) DAPI staining of nuclei. E) Merged image of Tcf4, αSMA and DAPI staining in the SC-Dep muscle cross-section. The orange arrowhead in B-E identifies a rare Tcf4+/αSMA+ myofibroblast. Scale bar=20 µM. F) Quantification of Tcf4+ fibrogenic cells in SC-WT and SC-Dep skeletal muscle at baseline (sham), SA1 and SA2. † denotes significant difference from sham; p <0.05 (N = 5 mice/group). G) Quantification of percentage of Tcf4+ cells that also express αSMA in SC-WT and SC-Dep skeletal muscle at baseline (sham), SA1 and SA2. † denotes significant difference from sham; p <0.05 (N = 5 mice/group). H) Quantification of fold change in Tcf4+ fibrogenic cells in SC-WT and SC-Dep skeletal muscle at baseline (sham) and SA8. † denotes significant difference from sham; ‡ denotes significant difference from SC-WT; p <0.05 (N = 6 mice/group). All data presented as Mean ± SEM.
Figure 2
Figure 2. Dicer deletion affects myogenic progenitor cell (MPC) exosome-mediated regulation of fibrogenic cell ECM mRNA accumulation in vitro and MPC viability in vivo
A) Primary fibrogenic cell collagen and fibronectin mRNA expression following culture for 24 hr in control medium, fibrogenic (Fb) conditioned medium (CM), MPC CM, and Fb CM + MPC exosomes. See also Figure S2C and S6 and Table S1–S3. * denotes significant effect of MPC CM/MPC exosomes; p < 0.05 (N = 3–5 isolates studied in duplicate). B) Primary fibrogenic cells containing acridine orange-labeled RNA from MPC exosomes. Scale bar = 50 µm. C) Select Pax7-Dicer MPC exosome miRNA expression levels following vehicle (Control) or tamoxifen treatment to conditionally knock out (cKO) dicer activity. * denotes significant effect of Dicer cKO; p < 0.05 (N = 2 isolates studied in duplicate). D) Primary fibrogenic cell collagen mRNA expression. * denotes significant effect of Dicer cKO; p < 0.05 (N = 3 isolates studied in duplicate). Quantification of E) average cross-sectional area, F) α-wheat germ agglutinin (WGA) stained area as a percent of total muscle areas, and G) Pax7+ satellite cells in the plantaris from Dicer cKO and Control SA8 muscle. Dashed red line in E and F indicates sham values. * denotes significant difference between Dicer cKO and Control; p < 0.05 (N = 4 animals/group). H) Quantification of satellite cell content in Dicer cKO and Control skeletal muscle during days 3 (SAd3), 6 (SAd6) and 9 (SAd9) of overload. * denotes significant difference between WT and cKO within the respective group; † significant increase relative to sham condition within that respective time point; p < 0.05 (N = 3 animals/group/time point). All data presented as Mean ± SEM.
Figure 3
Figure 3. Myogenic progenitor cell (MPC) exosome-derived miR-206 regulates fibrogenic cell collagen expression through ribosomal binding protein 1 (Rrbp1)
Primary fibrogenic cell A) miR-206 content, B) Rrpb1 mRNA abundance and C) Rrbp1 protein content. * significant effect of MPC exosomes; p < 0.05. Primary fibrogenic cell D) Rrbp1 mRNA content and E) protein content. * denotes significant effect of miR-206 transfection; p < 0.05. F) MPC and MPC exosome miRNA content following transfection with antagomiR-206. Primary fibrogenic cell G) Rrbp1 mRNA abundance, H) Rrbp1 protein content and I) collagen and fibronectin mRNA abundance. See also Figure S3 and S6 and Table S1–S3. * denotes significant effect of miR-206 depletion by antagomiR (anti-206) on MPC exosome effects; p < 0.05 (For all experiments, N = 3 independent primary cell isolates studied in duplicate). All data presented as Mean ± SEM.
Figure 4
Figure 4. Depletion of satellite cells results in lower miR-206 expression and higher Rrbp1 and collagen expression in vivo during the early phases of mechanical overload
A) miR-206 expression levels. * denotes significant difference between SC-WT and SC-Dep within the respective time point; † significant increase relative to Sham condition within that respective group; p < 0.05 (N = 6–11 animals/group/time point). B), Rrbp1 mRNA levels. ‡ denotes significant difference for SC-Dep group; † denotes significant increase relative to sham; p < 0.05 (N = 6–11 animals/group/time point). C) Quantification of Rrbp1 protein levels at SA1 using western blot. * denotes significant difference between SC-WT and SC-Dep; † denotes significant difference for surgery; p <0.05 (N = 7–8 animals/group). D), Col1a2, E), Col3a1 and F), Col12a1 mRNA levels. ‡ denotes significant difference for SC-Dep group; p < 0.05; Col3a1 trend for significant main effect; P = 0.06 (N = 7–11 animals/group/time point). Data presented as Mean ± SEM. See also Figure S4 and S5.
Figure 5
Figure 5. Presence of activated satellite cells/MPCs during the acute phase of ECM remodeling prevents excessive ECM accumulation and promotes long term growth
A) Experimental schematic for conditional depletion of activated satellite cells following one week of mechanical overload (SC-DepSA1). Animals were mechanically overloaded using synergist ablation or sham operated, and then treated with tamoxifen or vehicle at SA1; sham or overload continued for an additional 7 weeks (Sham and SA8, respectively). B) Immunohistochemical identification of Pax7+ satellite cells (red) and laminin (green) in both SC-WTSA1 and SC-DepSA1 muscle cross-sections at SA8. Scale bar=50 µM. Arrows identify Pax7+ cells, quantified in C). * denotes significant difference between SC-WTSA1 and SC-DepSA1 within the respective time point; † significant increase relative to Sham condition within that respective group; p < 0.05 (N = 6–9 animals/group/time point). D) Quantification of the number of myonuclei in isolated fibers per 100 µM fiber length in SC-WTSA1 and SC-DepSA1 animals. * denotes significant difference between SC-WTSA1 and SC-DepSA1 within the respective time point; denotes † significant increase relative to Sham condition within that respective group; p < 0.05 (N = 5–8 animals/group/time point with data points from each animal generated from 15–20 fibers). E) Quantification of α-wheat germ agglutinin (WGA) area as a percent of total muscle area. Data are presented as the fold-difference from the Vehicle Sham condition within each experimental paradigm. * denotes significant difference between SC-WT and SC-Dep within the respective time point; † denotes significant increase relative to Sham condition; p < 0.05 (N = 3–6 mice/group/time point). F) Representative images of Sirius Red histochemistry of interstitial collagen content. Scale bar=50 µm. G) Quantification of Sirius Red area as a percent of total muscle area. Data are presented as the fold-difference from the Vehicle Sham condition within each experimental paradigm. ‡ denotes significant difference for SC-Dep; † significant increase relative to Sham condition; p < 0.05 (N = 4–7 mice/group/time point). H) Plantaris muscle mass normalized to body weight. † denotes significant difference for surgery; * denotes significant difference between SC-WT and SC-Dep within the respective time point; p < 0.05 (N = 6–9 mice/group/time point). I) Quantification of the average cross-sectional area of the different fiber types. † denotes significant difference for surgery; p < 0.05 (N = 6–9 mice/group). Data presented as Mean ± SEM unless otherwise stated. Data for SC-WT and SC-Dep animals in Panels F and I has be recreated from previously published data (Fry et al., 2014) for comparison to the effects of SC-WTSA1 and –DepSA1. See also Figure S7.
Figure 6
Figure 6. Model of the interaction between satellite cells and muscle fibrogenic cells during the acute phase of ECM remodeling and myofiber hypertrophy
Satellite cells become activated by mechanical overload, proliferate and secrete exosomes into the extracellular niche. The exosomes containing miRNA, including miR-206, are released from the activated satellite cells/MPCs, which then dock and release their contents into nearby muscle fibrogenic cells. MPC-enriched miR-206 binds the Rrbp1 mRNA 3’-UTR, leading to a reduction in both mRNA and protein content, which is associated with reduced collagen mRNA expression in muscle fibrogenic cells. This regulatory mechanism is imperative during the first week of mechanical overload, the time when ECM remolding and collagen expression is the highest, in order to facilitate appropriate remodeling and prevent fibrosis. The absence of activated satellite cells during this critical remodeling period results in unregulated expression of Rrbp1 and collagen, resulting in increased ECM deposition and attenuated myofiber growth. Dashed inhibitory line represents unspecified Rrbp1 negative regulation of collagen mRNA expression.

Comment in

References

    1. Alexakis C, Partridge T, Bou-Gharios G. Implication of the satellite cell in dystrophic muscle fibrosis: a self-perpetuating mechanism of collagen overproduction. Am J Physiol Cell Physiol. 2007;293:C661–C669. - PubMed
    1. Alnaqeeb MA, Al Zaid NS, Goldspink G. Connective tissue changes and physical properties of developing and ageing skeletal muscle. J Anat. 1984;139(Pt 4):677–689. - PMC - PubMed
    1. Barberi L, Scicchitano BM, De Rossi M, Bigot A, Duguez S, Wielgosik A, Stewart C, McPhee J, Conte M, Narici M, et al. Age-dependent alteration in muscle regeneration: the critical role of tissue niche. Biogerontology. 2013;14:273–292. - PMC - PubMed
    1. Bentzinger CF, Wang YX, von Maltzahn J, Soleimani VD, Yin H, Rudnicki MA. Fibronectin regulates Wnt7a signaling and satellite cell expansion. Cell Stem Cell. 2013;12:75–87. - PMC - PubMed
    1. Benyamini P, Webster P, Meyer DI. Knockdown of p180 Eliminates the Terminal Differentiation of a Secretory Cell Line. Mol Biol Cell. 2009;20:732–744. - PMC - PubMed

Publication types

MeSH terms