. 2016 Nov 17;64(4):774-789.
doi: 10.1016/j.molcel.2016.10.012. Epub 2016 Nov 10.

CRY2 and FBXL3 Cooperatively Degrade c-MYC

Affiliations

CRY2 and FBXL3 Cooperatively Degrade c-MYC

Anne-Laure Huber et al. Mol Cell. .

Abstract

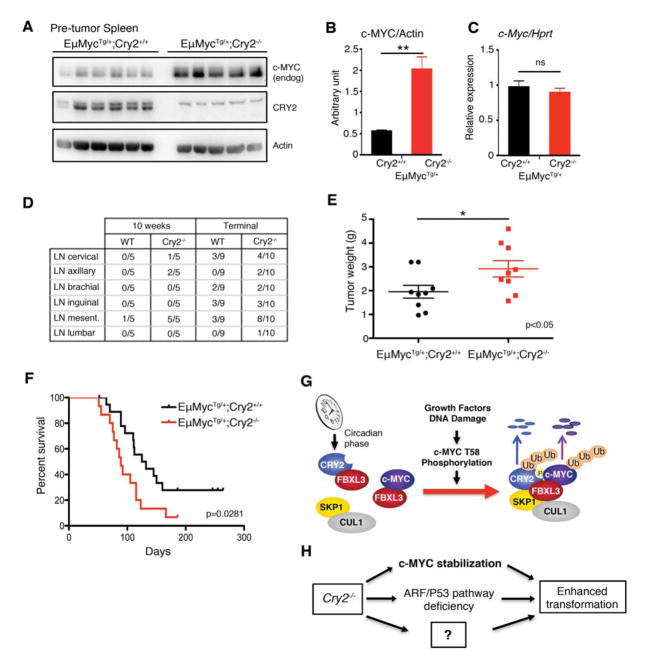
For many years, a connection between circadian clocks and cancer has been postulated. Here we describe an unexpected function for the circadian repressor CRY2 as a component of an FBXL3-containing E3 ligase that recruits T58-phosphorylated c-MYC for ubiquitylation. c-MYC is a critical regulator of cell proliferation; T58 is central in a phosphodegron long recognized as a hotspot for mutation in cancer. This site is also targeted by FBXW7, although the full machinery responsible for its turnover has remained obscure. CRY1 cannot substitute for CRY2 in promoting c-MYC degradation. Their unique functions may explain prior conflicting reports that have fueled uncertainty about the relationship between clocks and cancer. We demonstrate that c-MYC is a target of CRY2-dependent protein turnover, suggesting a molecular mechanism for circadian control of cell growth and a new paradigm for circadian protein degradation.

Keywords: CRY2; FBXL3; MYC; circadian clock; circadian rhythm; cryptochrome; ubiquitin.


Figures

Figure 1
Figure 1. CRY2 deletion enhances cell growth and transformation. See also Figure S1
Proliferation (A–F) and colony formation in 2-dimensional culture (G) in primary MEFs of indicated genotypes subjected to 3T3 protocol (Spont. Imm.) or stably expressing the indicated plasmids. (H) mRNA (left) and protein (right) measured by immunoblot (IB) or quantitative PCR (qPCR) from MEFs of the indicated genotypes stably overexpressing c-MYC. (I–K) Proteins measured by IB from adult skin fibroblasts (I–J) or MEFs (K) of the indicated genotypes stably expressing the indicated plasmids. (L–N) Endogenous mRNA (L) and proteins (M) detected by qPCR or IB in MEFs of the indicated genotypes and harvested at the indicated times (CT: hours after circadian synchronization). (N) Quantitation of the IB data shown in (M). In (A–G), data represent the mean ± s.d. for triplicate samples (A–F) or a typical result (G) from a representative experiment of at least 3 experiments of each type performed in 3 sets of MEFs derived from littermate animals. Similar results were obtained using 2 sets of adult skin fibroblasts derived from littermate animals.
Figure 2
Figure 2. CRY2 deletion increases c-MYC stability. See also Figure S2, Table S1 and Table S2
(A–C) Endogenous proteins detected by IB in MEFs of the indicated genotypes expressing the indicated plasmids and harvested at the indicated times (CHX: minutes after cycloheximide). (B) Samples from time 0 for all cell lines shown in (A) loaded together. (D,E) Transcripts measured by qPCR in primary MEFs of the indicated genotypes at the indicated times after synchronization of circadian rhythms with dexamethasone treatment. Data represent the mean ± s.d. for three biological replicates each measured in triplicate. (F) Heat-map from RNA sequencing in primary MEFs at the indicated times after circadian synchronization. Colors represent high (red) to low (blue) expression. Gene names and expression values are provided in Supplemental Table S2.
Figure 3
Figure 3. c-MYC forms a trimeric complex with CRY2 and FBXL3. See also Figure S3
(A,B,D,E,H–J) Proteins detected by IB following FLAG, HA, or V5 IP from nuclear and cytoplasmic fractions or whole cell lysates from 293T cells expressing the indicated plasmids. (C) Schematic representation of the wildtype and amino- or carboxy-terminal deletion mutants of c-MYC used in experiments shown in Figures 3B and 3C. (F) Superposition of crystal structures from Protein Data Bank accession numbers 1LDK (SKP1-SKP2-CUL1-RBX1), 2OVR (SKP1-FBW7-CYCEDEGN), 2AST (SKP1-SKP2-CKS1-p27KIP1), and 4I6J (SKP1-FBXL3-CRY2). (G) Proteins detected by IB in whole cell lysates of wildtype MEFs expressing the indicated viral shRNA.
Figure 4
Figure 4. CRY2 is an essential component of SCFFBXL3-driven c-MYC ubiquitylation. See also Figure S4
Proteins detected by IB following HA IP (A) or in whole cell lysates (B,C,G,H) from 293T cells expressing the indicated plasmids or from primary MEFs of the indicated genotypes expressing the indicated plasmids (I–L) and following treatment with cycloheximide (CHX) for the indicated times (C,G,I,K). (A) Monoclonal antibody (Mono Ab) was used to detect c-MYC (E) Proteins detected by autoradiography after a 35S-Methionine Pulse-Chase from 293T cells expressing the indicated plasmids. (D,F) Quantitation of the IB data (D) or the autoradiography data (F) showed in (C) and (E) respectively. Data represent the mean ± s.d. for triplicate samples. In (D,F) * P<0.05, ** P<0.01 vs. c-MYC control by 2-way ANOVA. In (H,J,L) samples from time 0 for cell lines shown in (G,I,K) were loaded together for comparison. In (A) cells were treated with MG132 for 4 hours prior to lysis.
Figure 5
Figure 5. SCFFBXL3+CRY2 interacts specifically with T58-phosphorylated c-MYC. See also Figure S5
(A) Top: Phosphate-binding loop (P-LOOP, magenta) at the interface of CRY2 (blue) and FBXL3 (red). Middle: Superposition of crystal structures from Protein Data Bank accession numbers 1LDK (SKP1-SKP2-CUL1-RBX1), 4I6J (SKP1-FBXL3-CRY2), and 4MLP (CRY2-KL001) with the CRY2 P-LOOP highlighted in magenta. Bottom: 90 degree rotation of the above image. (B,C) Proteins detected by IB following FLAG IP from 293T cells expressing the indicated plasmids. (D,E) Proteins detected by IB following streptavidin affinity purification after incubation of purified Flag-CRY2 and/or Flag-FBXL3 with the indicated biotinylated peptides. (F,J) Proteins detected by IB in whole cell lysates from 293T cells expressing the indicated plasmids and harvested at the indicated times (CHX: minutes after cycloheximide). (H) Proteins detected by autoradiography after a 35S-Methionine Pulse-Chase from 293T cells expressing the indicated plasmids. (G,I) Quantitation of the IB data (G) or the autoradiography data (I) showed in (F) and (H) respectively. Data represent the mean ± s.d. for triplicate samples. * P<0.05 vs. c-MYCT58A control by 2-way ANOVA.
Figure 6
Figure 6. Low CRY2 expression enhances growth of human cancer cell lines. See also Table S3
Proteins detected by IB (A), proliferation (C), and colony formation in soft agar (D) in SW480 and A549 cells expressing the indicated plasmids. (B) Quantitation of the IB data shown in (A). (E–G) CRY2, CRY1, and FBXL3 expression in human tumor vs. normal samples.
Figure 7
Figure 7. CRY2 deletion enhances MYC-driven lymphoma in vivo. See also Figure S6
(A) Proteins detected by IB in spleen samples taken from 6-week-old EμMyc+/−;Cry2+/+ and EμMyc+/−;Cry2−/− littermates. (B) Quantitation of proteins from WB in (A). (C) mRNA expression measured by qPCR in spleen samples used in (A). (D) Numbers of solid tumors observed in the indicated locations in EμMyc+/−;Cry2+/+ and EμMyc+/−;Cry2−/− littermates of the indicated ages or at the time of sacrifice necessitated by advanced disease progression. LN, lymph node. (E,F) Total combined tumor weight (E) and survival (F) at time of sacrifice due to advanced disease progression in EμMyc+/−;Cry2+/+ (black, N=19) and EμMyc+/−;Cry2−/− (red, N=15) littermates. In (B,C) data represent the mean ± s.d. of samples from 5 mice for which IB data is shown in (A). In (B,E) * P<0.05, ** P<0.01 by t-test. In (F), P value is from log-rank calculations. (G) Schematic model for the role of CRY2 as a cofactor for SCFFBXL3-driven ubiquitylation of phosphorylated c-MYC. (H) Deletion of Cry2 may contribute to cellular transformation in a pleiotropic manner.

References

    1. Adams JM, Harris AW, Pinkert CA, Corcoran LM, Alexander WS, Cory S, Palmiter RD, Brinster RL. The c-myc oncogene driven by immunoglobulin enhancers induces lymphoid malignancy in transgenic mice. Nature. 1985;318:533–538. - PubMed
    1. Altman BJ, Hsieh AL, Sengupta A, Krishnanaiah SY, Stine ZE, Walton ZE, Gouw AM, Venkataraman A, Li B, Goraksha-Hicks P, et al. MYC Disrupts the Circadian Clock and Metabolism in Cancer Cells. Cell metabolism 2015 - PMC - PubMed
    1. Balsalobre A, Brown SA, Marcacci L, Tronche F, Kellendonk C, Reichardt HM, Schutz G, Schibler U. Resetting of circadian time in peripheral tissues by glucocorticoid signaling. Science. 2000;289:2344–2347. - PubMed
    1. Bhatia K, Huppi K, Spangler G, Siwarski D, Iyer R, Magrath I. Point mutations in the c-Myc transactivation domain are common in Burkitt’s lymphoma and mouse plasmacytomas. Nature genetics. 1993;5:56–61. - PubMed
    1. Bhatia K, Spangler G, Gaidano G, Hamdy N, Dalla-Favera R, Magrath I. Mutations in the coding region of c-myc occur frequently in acquired immunodeficiency syndrome-associated lymphomas. Blood. 1994;84:883–888. - PubMed

Publication types

MeSH terms