. 2016 Nov 21;39(4):480-490.
doi: 10.1016/j.devcel.2016.10.001. Epub 2016 Nov 10.

Single-Cell Resolution of Temporal Gene Expression during Heart Development

Affiliations

Single-Cell Resolution of Temporal Gene Expression during Heart Development

Daniel M DeLaughter et al. Dev Cell. .

Abstract

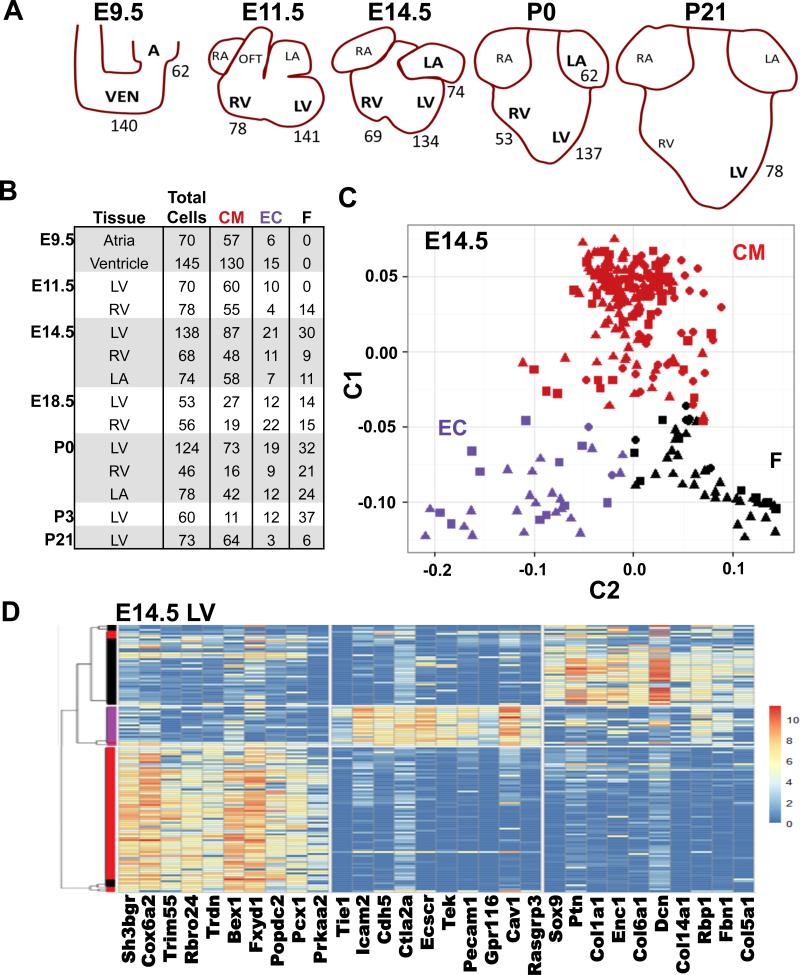
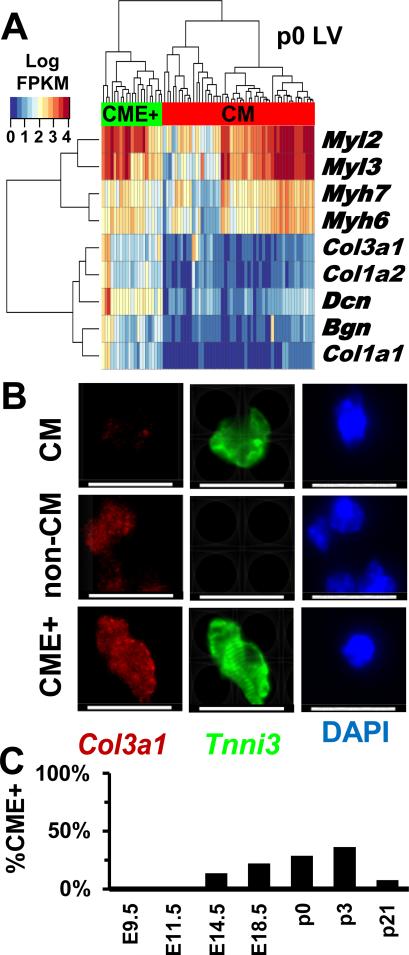
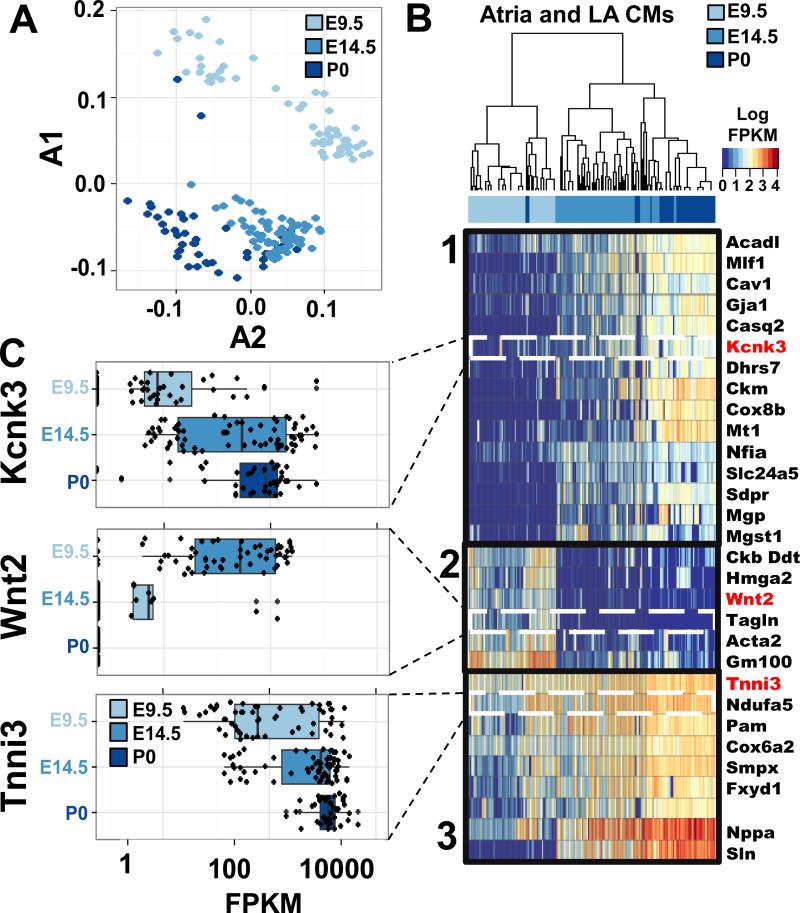
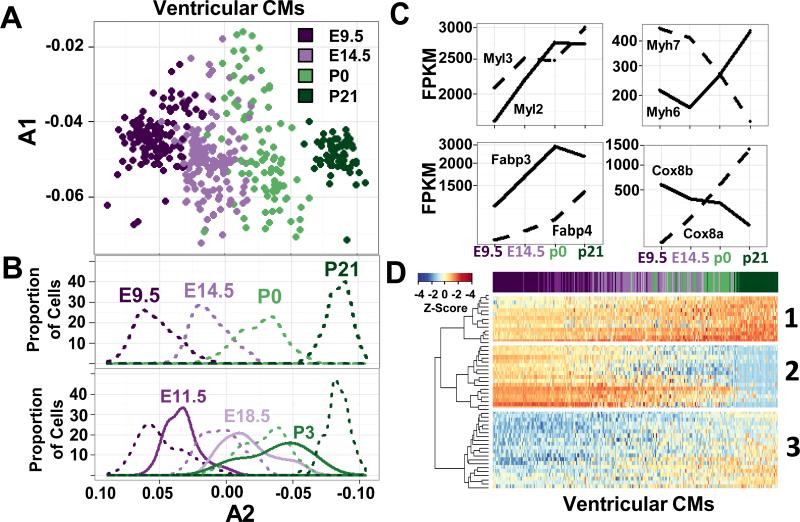
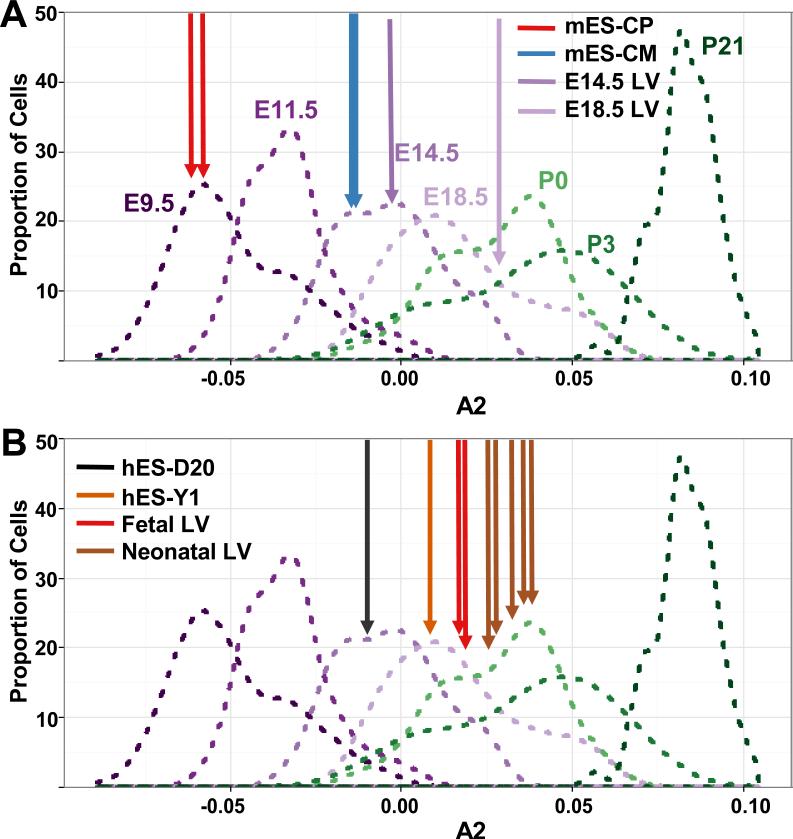
Activation of complex molecular programs in specific cell lineages governs mammalian heart development, from a primordial linear tube to a four-chamber organ. To characterize lineage-specific, spatiotemporal developmental programs, we performed single-cell RNA sequencing of >1,200 murine cells isolated at seven time points spanning embryonic day 9.5 (primordial heart tube) to postnatal day 21 (mature heart). Using unbiased transcriptional data, we classified cardiomyocytes, endothelial cells, and fibroblast-enriched cells, thus identifying markers for temporal and chamber-specific developmental programs. By harnessing these datasets, we defined developmental ages of human and mouse pluripotent stem-cell-derived cardiomyocytes and characterized lineage-specific maturation defects in hearts of mice with heterozygous mutations in Nkx2.5 that cause human heart malformations. This spatiotemporal transcriptome analysis of heart development reveals lineage-specific gene programs underlying normal cardiac development and congenital heart disease.

Keywords: ECM; Nkx2.5; RNA-seq; atria; cardiogenesis; cardiomyocyte maturation; heart; single cell; ventricle.


Figures

Figure 1
Figure 1
Single-cell RNA-seq of CMs, ECs, and fibroblast-enriched cells in the developing heart. A) Schematic representation of developing heart from which single cells were harvested (denoted by bold lettering). Numbers indicate numbers of captured wildtype cells. B) The number single cells captured per tissue and time point and their lineage as determined by PCA. CM, cardiomyocytes, EC, endothelial cells, F, fibroblast-enriched cells. C) PCA components C1 and C2 separates E14.5 cells into three subgroups, each that robustly expressed genes associated with CMs (red), ECs (E, purple), or Fs (black). The percent of variance explained each principle component is provided in Table S2. D) Unsupervised clustering (SC3) of E14.5 cells separates CMs, ECs, and fibroblast-enriched cells. The dendrogram was generated using consensus clustering with k=3. The heatmap depicts the top ten most significant genes with enriched expression in each cluster. See also Fig S1, Fig S4, Table S1, Table S2, and Table S3.
Figure 2
Figure 2
Subpopulations of CMs with distinct gene expression profiles. A) Hierarchical clustering distinguishes CMs (red) from CMs expressing extracellular matrix genes (CME+, green) isolated from the LV at p0. B) Micrographs of p3 LV cells stained with Tnni3 (green), Col3 (red), or DAPI (blue). Scale bar- 20μM. C) The proportion of LV CMs and CME+ cells varies during development. See also Fig S1 and Fig S2.
Figure 3
Figure 3
Distinct temporal and chamber gene expression patterns in CMs. A) PCA of gene expression in E9.5 common atria (light blue), E14.5 LA (blue), and P0 LA (dark blue) demonstrate that atrial CMs exhibited stepwise, temporal expression patterns. The percent of variance explained each principle component is provided in Table S2. B) Hierarchical clustering of E9.5 common atria (light blue), E14.5 LA (blue), and P0 LA (dark blue) CMs show three temporal gene expression programs. C) Representative genes depicting single cell gene expression (black dots) from each of the three temporal atrial CM gene expression programs. See also Fig S4, Table S2, and Table S5.
Figure 4
Figure 4
Temporal gene expression profiles of ventricular CMs. A) PCA of ventricular CMs isolated at E9.5 (dark purple), E14.5 (light purple), P0 (light green), and P21 (dark green). The percent of variance explained each principle component is provided in Table S2. B) (Top panel) A density plot depicting the proportion of ventricular CMs isolated at four time points (E9.5, E14.5, P0, P21) on component A2. These time points were evenly distributed along A2. (Bottom panel) Density plot depicting the proportion of cells with a given value of component A2 from PCA of CMs isolated at seven time points (E9.5, E11.5, E14.5, E18.5, P0, P3, P21), show considerable overlap in temporal development from E14.5-P3. C) Box plots depict mean fragments per kilobase of transcript per million mapped reads (FPKM) of genes with notable isoform switches in CMs isolated at E9.5, E14.5, P0, or P21. D) Hierarchical clustering of the top 50 genes in component A2 from B. The genes clustered into three patterns (detailed in text). Columns represent individual single cells ordered by value of component A2 from B and colored by age at time of isolation. Z-score reflected normalization by column. See also Fig S4, Fig S6, Table S2, Table S6, and Table S7.
Figure 5
Figure 5
Developmental ages of CMs derived from human and mouse stem cell and LV tissues (depicted using density plots as described in Fig. 4B). A) Murine whole tissue samples from E14.5 (purple arrow) and E18.5 LV (light purple arrow) have A2 values near the mean of the distribution of E14.5 and E18.5 LV single cells respectively. Murine embryonic stem cell-derived cardiac progenitors (mES-CP, red arrow) correspond to E9.5 CMs and murine embryonic stem cell-derived CM lines (mES-CM, blue arrow) correspond to E14.5 CMs. mES transcriptome data are from two independent clonal lines (Wamstad Cell 2012). B) Similar analyses of transcriptional analyses from pooled human embryonic stem cell-derived CMs (Kuppusamy, PNAS 2015) cultured for 20 days (hES-D20, black arrow) or one year (hES-Y1, orange arrow) indicate that these respectively correspond to mouse E14.5 and E18.5 CMs. The transcriptome of the free wall of human fetal LV (ages 8 and 12 weeks, red arrow, n=2) and human neonatal LV or RV (brown arrow; n=5) are shown for comparison. See also Table S6.
Figure 6
Figure 6
Maturation defects in Nkx2.5+/− CMs. A) Developmental profile of E9.5 VEN and E14.5, P0, and P21 LV CMs from WT (dashed line) and Nkx2.5+/− mice (solid line) depicted using density plots as described in Fig. 4B. At E14.5 (2nd panel), Nkx2.5+/− CMs are less mature than E14.5 WT cells. This immaturity decreases gradually from P0 (3rd panel) to P21 (4th panel). B) Using hierarchical clustering, the proportion Nkx2.5+/− CMs (CM) that cluster with similarly aged WT cells is significantly different at all time points (Fisher's exact p-values: E14.5= 2.1×10⁻²⁵, P0= 0.0012, P7= 0.010, P21= 0.0071). See also Fig S5 and Table S4.

References

    1. Ambrosino C, Iwata T, Scafoglio C, Mallardo M, Klein R, Nebreda AR. TEF-1 and C/EBPbeta are major p38alpha MAPK-regulated transcription factors in proliferating cardiomyocytes. Biochem J. 2006;396:163–172. - PMC - PubMed
    1. Ashraf H, Pradhan L, Chang EI, Terada R, Ryan NJ, Briggs LE, Chowdhury R, Zarate MA, Sugi Y, Nam HJ, et al. A mouse model of human congenital heart disease: high incidence of diverse cardiac anomalies and ventricular noncompaction produced by heterozygous Nkx2-5 homeodomain missense mutation. Circ Cardiovasc Genet. 2014;7:423–433. - PMC - PubMed
    1. Benecke AG, Eilebrecht S. RNA-Mediated Regulation of HMGA1 Function. Biomolecules. 2015;5:943–957. - PMC - PubMed
    1. Biben C, Weber R, Kesteven S, Stanley E, McDonald L, Elliott DA, Barnett L, Koentgen F, Robb L, Feneley M, et al. Cardiac septal and valvular dysmorphogenesis in mice heterozygous for mutations in the homeobox gene Nkx2-5. Circulation research. 2000;87:888–895. - PubMed
    1. Bick AG, Calvo SE, Mootha VK. Evolutionary diversity of the mitochondrial calcium uniporter. Science. 2012;336:886. - PMC - PubMed

Publication types

MeSH terms

Substances