Comprehensive analysis of glucose and xylose metabolism in Escherichia coli under aerobic and anaerobic conditions by 13C metabolic flux analysis
- PMID: 27840237
- PMCID: PMC5845445
- DOI: 10.1016/j.ymben.2016.11.003
Comprehensive analysis of glucose and xylose metabolism in Escherichia coli under aerobic and anaerobic conditions by 13C metabolic flux analysis
Abstract
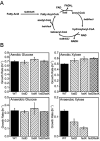
Glucose and xylose are the two most abundant sugars derived from the breakdown of lignocellulosic biomass. While aerobic glucose metabolism is relatively well understood in E. coli, until now there have been only a handful of studies focused on anaerobic glucose metabolism and no 13C-flux studies on xylose metabolism. In the absence of experimentally validated flux maps, constraint-based approaches such as MOMA and RELATCH cannot be used to guide new metabolic engineering designs. In this work, we have addressed this critical gap in current understanding by performing comprehensive characterizations of glucose and xylose metabolism under aerobic and anaerobic conditions, using recent state-of-the-art techniques in 13C metabolic flux analysis (13C-MFA). Specifically, we quantified precise metabolic fluxes for each condition by performing parallel labeling experiments and analyzing the data through integrated 13C-MFA using the optimal tracers [1,2-13C]glucose, [1,6-13C]glucose, [1,2-13C]xylose and [5-13C]xylose. We also quantified changes in biomass composition and confirmed turnover of macromolecules by applying [U-13C]glucose and [U-13C]xylose tracers. We demonstrated that under anaerobic growth conditions there is significant turnover of lipids and that a significant portion of CO2 originates from biomass turnover. Using knockout strains, we also demonstrated that β-oxidation is critical for anaerobic growth on xylose. Quantitative analysis of co-factor balances (NADH/FADH2, NADPH, and ATP) for different growth conditions provided new insights regarding the interplay of energy and redox metabolism and the impact on E. coli cell physiology.
Keywords: Co-factor balances; Flux estimation; Metabolism; Model validation; Parallel labeling experiments.
Copyright © 2016 International Metabolic Engineering Society. Published by Elsevier Inc. All rights reserved.
Figures


References
-
- Antoniewicz MR. 13C metabolic flux analysis: optimal design of isotopic labeling experiments. Curr Opin Biotechnol. 2013;24:1116–21. - PubMed
-
- Antoniewicz MR. Methods and advances in metabolic flux analysis: a mini-review. J Ind Microbiol Biotechnol. 2015a;42:317–25. - PubMed
-
- Antoniewicz MR. Parallel labeling experiments for pathway elucidation and 13C metabolic flux analysis. Curr Opin Biotechnol. 2015b;36:91–97. - PubMed
-
- Antoniewicz MR, Kelleher JK, Stephanopoulos G. Determination of confidence intervals of metabolic fluxes estimated from stable isotope measurements. Metab Eng. 2006a;8:324–37. - PubMed
-
- Antoniewicz MR, Kelleher JK, Stephanopoulos G. Accurate assessment of amino acid mass isotopomer distributions for metabolic flux analysis. Anal Chem. 2007a;79:7554–9. - PubMed
MeSH terms
Substances
Grants and funding
LinkOut - more resources
Full Text Sources
Other Literature Sources
Molecular Biology Databases
Miscellaneous

