Review
. 2017 Feb;18(2):117-127.
doi: 10.1038/nrg.2016.142. Epub 2016 Nov 14.

Dissecting the genetics of complex traits using summary association statistics

Affiliations
Review

Dissecting the genetics of complex traits using summary association statistics

Bogdan Pasaniuc et al. Nat Rev Genet. 2017 Feb.

Abstract

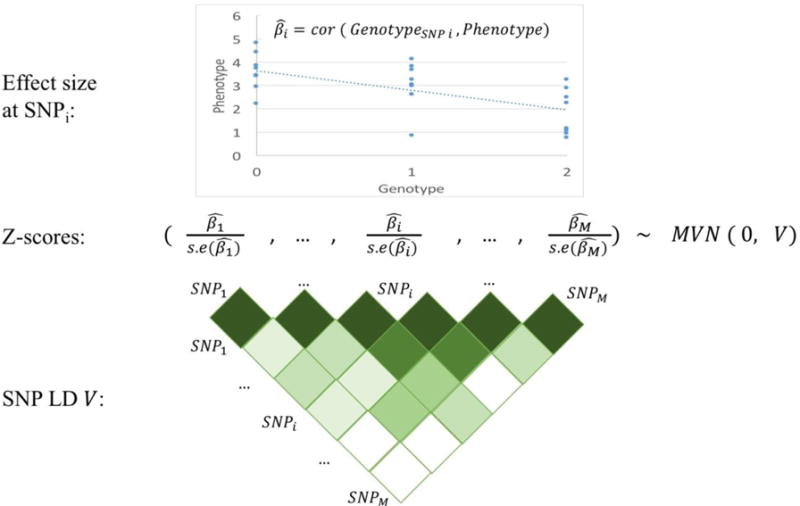
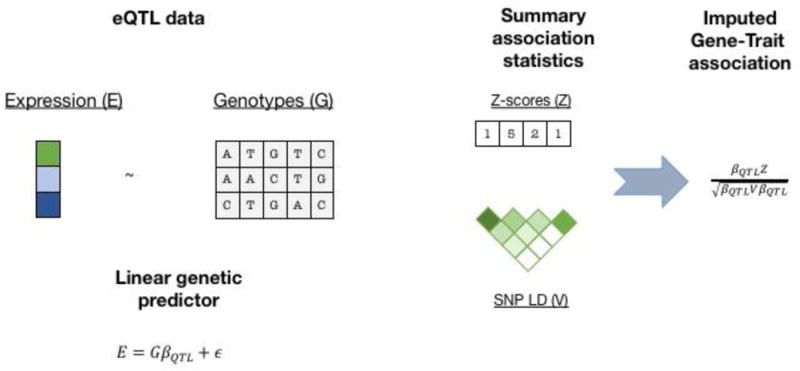
During the past decade, genome-wide association studies (GWAS) have been used to successfully identify tens of thousands of genetic variants associated with complex traits and diseases. These studies have produced extensive repositories of genetic variation and trait measurements across large numbers of individuals, providing tremendous opportunities for further analyses. However, privacy concerns and other logistical considerations often limit access to individual-level genetic data, motivating the development of methods that analyse summary association statistics. Here, we review recent progress on statistical methods that leverage summary association data to gain insights into the genetic basis of complex traits and diseases.


Conflict of interest statement

Competing interests

No competing interests

Figures

Figure 1
Figure 1. Illustration of summary association statistics
Per-allele SNP effect sizes (and their standard errors) are typically estimated by regressing the phenotype on the genotype values at the SNP of interest (top). At large sample sizes, the vector of z-scores (effect sizes divided by their standard errors) at a locus are approximated by a multivariate normal distribution with mean 0 and variance equal to the LD matrix V (bottom).
Figure 2
Figure 2. TWAS using predicted expression and summary data
TWAS using predicted expression and summary data follows two steps. First, transcriptome reference data is used to build a linear predictor for gene expression, typically using SNPs from the 1Mb local region around the gene with regularized effect sizes (e.g. using BSLMM). Second, this predictor is applied to summary GWAS z-scores and gene-trait association z-scores are computed, testing the null model of no association between gene and trait.
Figure 3
Figure 3. Leveraging functional annotation and trans-ethnic data to improve fine-mapping
A sample locus with simulated fine-mapping data in Europeans and Africans is displayed. The top panel shows the 99% credible set (denoted in red) produced by leveraging functional annotation data (DNase I Hypersensitivity Sites, DHS) in trans-ethnic fine-mapping. The middle and bottom panels show the –log 10 p-values (left) and LD (right) in Europeans and Africans.
Figure
Figure

Similar articles

Cited by

References

    1. Visscher PM, Brown MA, McCarthy MI, Yang J. Five Years of GWAS Discovery. American journal of human genetics. 2012 - PMC - PubMed
    1. 1000 Genomes Project Consortium et al. An integrated map of genetic variation from 1,092 human genomes. Nature. 2012;491:56–65. - PMC - PubMed
    1. Evangelou E, Ioannidis JP. Meta-analysis methods for genome-wide association studies and beyond. Nat Rev Genet. 2013;14:379–389. - PubMed
    1. Lin DY, Zeng D. Meta-analysis of genome-wide association studies: no efficiency gain in using individual participant data. Genetic epidemiology. 2010;34:60–66. - PMC - PubMed
    1. Han B, Eskin E. Random-effects model aimed at discovering associations in meta-analysis of genome-wide association studies. American journal of human genetics. 2011;88:586–598. This study introduced a powerful new random-effects meta-analysis method that employs a null model of no-heterogeneity. - PMC - PubMed