. 2017 Jan:186:118-138.
doi: 10.1016/j.jqsrt.2016.03.037. Epub 2016 Apr 11.

Multispectrum analysis of the oxygen A-band

Affiliations

Multispectrum analysis of the oxygen A-band

Brian J Drouin et al. J Quant Spectrosc Radiat Transf. 2017 Jan.

Abstract

Retrievals of atmospheric composition from near-infrared measurements require measurements of airmass to better than the desired precision of the composition. The oxygen bands are obvious choices to quantify airmass since the mixing ratio of oxygen is fixed over the full range of atmospheric conditions. The OCO-2 mission is currently retrieving carbon dioxide concentration using the oxygen A-band for airmass normalization. The 0.25% accuracy desired for the carbon dioxide concentration has pushed the required state-of-the-art for oxygen spectroscopy. To measure O2 A-band cross-sections with such accuracy through the full range of atmospheric pressure requires a sophisticated line-shape model (Rautian or Speed-Dependent Voigt) with line mixing (LM) and collision induced absorption (CIA). Models of each of these phenomena exist, however, this work presents an integrated self-consistent model developed to ensure the best accuracy. It is also important to consider multiple sources of spectroscopic data for such a study in order to improve the dynamic range of the model and to minimize effects of instrumentation and associated systematic errors. The techniques of Fourier Transform Spectroscopy (FTS) and Cavity Ring-Down Spectroscopy (CRDS) allow complimentary information for such an analysis. We utilize multispectrum fitting software to generate a comprehensive new database with improved accuracy based on these datasets. The extensive information will be made available as a multi-dimensional cross-section (ABSCO) table and the parameterization will be offered for inclusion in the HITRANonline database.

Keywords: atmospheric absorption; collision-induced absorption; multispectrum fitting; oxygen; spectral lineshapes.


Figures

Figure 1
Figure 1
Cavity Ring Down Spectra included in the multispectrum analysis. Pure and air (‘NIST standard’) were used. Four spectra at room temperature are plotted below: 0.133 kPa (1 Torr) O2 (red trace) and three (‘NIST standard’) air at 0.133, 53.3, 133.3 kPa (1,400,1000 Torr) in green, blue and black, respectively. Lower panels indicate residuals from the presented analysis, a few segments of the 53.3 kPa (400 Torr) air spectrum were removed from the analysis due to an unresolved calibration issue.
Figure 2
Figure 2
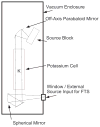
Schematic diagram of external source chamber containing calibration gas cell and 100W Tungsten filament bulb. Optics are standard items from Newport and are aligned with positioning stages prior to evacuation. The rest of the FTS was configured as in Ref. [31]
Figure 3
Figure 3
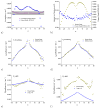
(top) Typical Fourier Transform spectra of air (black) and pure O2 (green) included in the multispectrum analysis. The pathlength is 52.00(5) m, the sample pressures are 120 kPa (899 Torr) air and 106 kPa (794 Torr) O2, and the cell temperatures are 187.9(4) K and 206.8(6) K, respectively. (bottom panels) residuals from analysis of the 22 spectra listed in Table 1 described in text.
Figure 4
Figure 4
Logarithm of the scaled irradiances (blue dots) (actually ln[R(11532)/Rref (11532)]) for July 18, 2012 (1836-2348 UT) plotted vs. water vapor airmass factor, mw, and the least-squares fitted line (blue). Also shown (red dots) are the values resulting from the sub-sampling procedure described in the text.
Figure 5
Figure 5
Difference between lower state energies of Yu et al. [40] and HITRAN2012 [28], plotted vs. the quantum number N″ where J″ = N″+S″.
Figure 6
Figure 6
Schematic representation of the line mixing collisional relaxation W matrix. Rows and columns each represent a given transition, which may occur in one of four sub- bands according to 3Σ − 1Σ selection rules, primes indicate a different transition within a given sub-band. Diagonal values (blue) are collisional parameters for a given transition per Eqs. 6 and 7. Off-diagonal values are taken from theory [22, 36] and incorporated into the data fitting program. Only the lower triangle (yellow and green) are input since the upper triangle (grey squares) is calculated by detailed balance within the program. Inclusion of all yellow (extra-subband) and green (intra-subband) elements results in substantial fitting residuals, but exclusion of the yellow (extra-subband) elements provides an acceptable solution.
Figure 7
Figure 7
Optical depths derived from TCCON FTS spectra (red), sum of O2 LBL+LM and LBLRTM optical depths (green), difference of TCCON FTS and O2 LBL+LM and LBLRTM optical depths (orange), aerosol optical depths (cyan) unknown optical depths (blue) and unknown optical depths filtered in 1 cm−1 bins (magenta, see text for description of filtering method)) for one of the cases analyzed in this study (July 18th, 2012, 4/69–2348 UT).
Figure 8
Figure 8
Comparison with Long et al. 2012 [23] (red) and Spiering et al. 2011 [58] (blue) and present study (green) collision induced absorption coefficients for air (ϱO2 = 0.21, (ϱN2 = 0.79). One amagat (am) is the density of gas at 101325 Pa and 273.15 K.
Figure 9
Figure 9
[top left] Selected atmospheric TCCON spectra used to validate results from July 18th, 2012 at solar zenith angles of 21° (brown) and 82° (blue). [top right] Residuals from prior work (ABSCO 4.2 in red) and present study (PS black) across the A-band, the 21° solar zenith angle residuals are offset and scaled by the background radiance ratio (40%) for clarity. Expanded views of residuals in P-branch maximum and R-branch band-head regions are given at solar zenith angle 21° [bottom left] and 82° [bottom right]. The bottom panels depict residuals from prior work (ABSCO 4.2 in red), a rejected analysis incorporating all of the line-mixing parameters from theory (PS (full LM) blue), the analysis presented in this work (PS - black). Spectral radiances are in photons/s/m2/sr/cm−1, but with arbitrary scaling.
Figure 10
Figure 10
(top) R-branch portion of FTS data scan with pathlength 52.00(5) m, sample pressure 106 kPa (794 Torr) pure O2 and cell temperature −66.35°C. (middle) Residuals following LBL optimization with full LM (scaled by 1/2) included. (lower) Residuals following LBL optimization with odd ΔJ LM removed (sub-branch mixing only).
Figure 11
Figure 11
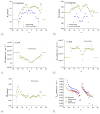
Least squares fitted and fixed values in the LBL for oxygen A-band. (a) position differences (this work - HITRAN2012) [blue], uncertainties in positions [purple], shaded box indicates CRDS accuracy, the FTS accuracy encompasses the chart (b) intensity values at 296 K [green] and ratios to HITRAN2012 [blue] (c) nitrogen broadened halfwidth coefficients, this work [green], (derived from) HITRAN2012 [blue] (d) oxygen broadened halfwidth coefficients, this work [green], HITRAN2012 [blue] (e) nitrogen pressure shift coefficients, this work [green], Long et al. [14] [blue] (f) oxygen pressure shift coefficients, this work [green], Long et al. [14] [blue].
Figure 12
Figure 12
Least squares fitted and fixed values in the LBL for oxygen A-band. (a) nitrogen broadening temperature exponents, this work [green], Brown and Plymate [21] [blue] (b) oxygen broadening temperature exponents [green], Brown and Plymate [21] [blue] (c) linear temperature dependences of the nitrogen pressure shift (d) linear temperature dependences of the oxygen pressure shift (e) speed dependence values (f) dispersion coefficients for air broadening compared with values obtained from Ref. [22] and calculated from data in Refs. [12, 13].

References

    1. Rothman LS, Barbe A, Benner DC, Brown LR, Camy-Peyret C, Carleer MR, et al. The HITRAN Molecular Spectroscopic Database: Edition Of 2000 Including Updates Through 2001. J Quant Spectrosc Radiat Transfer. 2003;82(1):5–44.
    1. Rothman LS, Jacquemart D, Barbe A, Benner DC, Birk M, Brown LR, et al. The HITRAN 2004 Molecular Spectroscopic Database. J Quant Spectrosc Radiat Transfer. 2005;96(2):139–204.
    1. Rothman LS, Gordon IE, Barbe A, Benner DC, Bernath PE, Birk M, et al. The HITRAN 2008 Molecular Spectroscopic Database. J Quant Spectrosc Radiat Transfer. 2009;110(9–10):533–572.
    1. Eldering A, Boland S, Solish B, Crisp D, Kahn P, Gunson M. High Precision Atmospheric CO2 Measurements From Space: The Design And Implementation Of OCO-2. Aerospace Conference, 2012 IEEE. 2012:1–10.
    1. O’Dell C, Connor B, Bösch H, O’Brien D, Frankenberg C, Castano R, et al. The ACOS CO2 Retrieval Algorithm Part 1: Description and Validation Against Synthetic Observations. Atmos Meas Tech Discuss. 2011;4(5):6097–6158. doi: 10.5194/amtd-4-6097-2011. - DOI

Publication types

LinkOut - more resources