. 2016 Oct 28:9:110.
doi: 10.3389/fnmol.2016.00110. eCollection 2016.

Hippocalcin Is Required for Astrocytic Differentiation through Activation of Stat3 in Hippocampal Neural Precursor Cells

Affiliations

Hippocalcin Is Required for Astrocytic Differentiation through Activation of Stat3 in Hippocampal Neural Precursor Cells

Min-Jeong Kang et al. Front Mol Neurosci. .

Abstract

Hippocalcin (Hpca) is a neuronal calcium sensor protein expressed in the mammalian brain. However, its function in neural stem/precursor cells has not yet been studied. Here, we clarify the function of Hpca in astrocytic differentiation in hippocampal neural precursor cells (HNPCs). When we overexpressed Hpca in HNPCs in the presence or absence of bFGF, expression levels of nerve-growth factors such as neurotrophin-3 (NT-3), neurotrophin-4/5 (NT-4/5), and brain-derived neurotrophic factor (BDNF), together with the proneural basic helix loop helix (bHLH) transcription factors NeuroD and neurogenin 1 (Ngn1), increased significantly. In addition, there was an increase in the number of cells expressing glial fibrillary acidic protein (GFAP), an astrocyte marker, and in branch outgrowth, indicating astrocytic differentiation of the HNPCs. Downregulation of Hpca by transfection with Hpca siRNA reduced expression of NT-3, NT-4/5, BDNF, NeuroD, and Ngn1 as well as levels of GFAP protein. Furthermore, overexpression of Hpca increased the phosphorylation of STAT3 (Ser727), and this effect was abolished by treatment with a STAT3 inhibitor (S3I-201), suggesting that STAT3 (Ser727) activation is involved in Hpca-mediated astrocytic differentiation. As expected, treatment with Stat3 siRNA or STAT3 inhibitor caused a complete inhibition of astrogliogenesis induced by Hpca overexpression. Taken together, this is the first report to show that Hpca, acting through Stat3, has an important role in the expression of neurotrophins and proneural bHLH transcription factors, and that it is an essential regulator of astrocytic differentiation and branch outgrowth in HNPCs.

Keywords: astrocyte; differentiation; hippocalcin (Hpca); hippocampal neural precursor cells; signal transducer and activation of transcription 3 (STAT3).


Figures
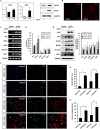
FIGURE 1
FIGURE 1
Effect of Hippocalcin (Hpca) on GFAP expression during differentiation of HNPCs. (A,B) HNPCs were induced to differentiate by withdrawal of bFGF. (A) After 48 h, mRNA levels of Hpca and Gfap were determined by real-time PCR. p < 0.001 compared with the +bFGF control. 20 μg aliquots of protein were analyzed by western blotting with anti-hippocalcin, anti-GFAP, and anti-GAPDH. (B) The cells were stained with anti-GFAP (red). Bar, 100 μm. (C–E) Cells were transfected with pMSCV-IRES-EGFP or pMSCV-Hpca-myc-IRES-EGFP for 48 h and then incubated for 24 h after removal of bFGF. The mRNA levels of neurotrophins and proneural bHLH transcription factors were analyzed by RT-PCR (C) and real-time PCR (D). Data are means ± SD of three independent experiments. p < 0.05; ∗∗p < 0.01 compared with the +bFGF/vector control. (E) Proteins were analyzed by western blotting with anti-Myc, anti-NT-3, anti-NT-4/5, anti-BDNF, anti-NeuroD, anti-Neurogenin 1, and anti-GAPDH. Graph shows mean densities as fold increases in three independent experiments (mean ± SD). Band intensities were quantified with Quantity Ones software. p < 0.05; ∗∗p < 0.01 compared with the +bFGF/vector control. (F) HNPCs were transduced with EGFP vector or Hpca-myc-EGFP for 48 h and induced to differentiate by withdrawal of bFGF. After differentiation for 72 h, fixed cells were immunostained with anti-GFP (green) and anti-GFAP (red). GFP-stained cells fluoresce green, and GFAP-stained cells fluoresce red, while cells stained with both GFP and GFAP fluoresce yellow. Bar, 100 μm. (G) Graph shows the percentages of GFAP-positive cells. GFAP-positive cells among GFP-positive cells were counted under a fluorescence microscopy. The proportions of GFAP-positive cells were determined in randomly selected areas from five cultures (means ± SD). p < 0.001 compared with the +bFGF/vector control. ∗∗p < 0.001 compared with the –bFGF/vector control. (H) Branch lengths were measured in random areas from five cultures (means ± SD). p < 0.01 compared with the +bFGF/vector control. ∗∗p < 0.01 compared with the –bFGF/vector control.
FIGURE 2
FIGURE 2
Effect of Hpca downregulation on astrocytic differentiation of HNPCs. (A–C) HNPCs were transfected with control siRNA or Hpca siRNA for 72 h and induced to differentiate by removal of bFGF for 24 h. (A) Cells were lysed and analyzed by western blotting with anti-hippocalcin, anti-GFAP, and anti-GAPDH. Graph shows mean densities as fold increases in three independent experiments (means ± SD). Band intensities were quantified with Quantity Ones® software. p < 0.05 compared with the -bFGF/control siRNA. The mRNA levels of neurotrophins and proneural bHLH transcription factors were analyzed by RT-PCR (B) and real-time PCR (C). Data are means ± SD of three independent experiments. p < 0.05; ∗∗p < 0.01 compared with the -bFGF/control siRNA. (D) Cells were transiently transfected with control siRNA or Hpca siRNA for 72 h and induced to differentiate by withdrawal of bFGF. After differentiation for 72 h, fixed cells were stained for immunocytochemical analysis of an astrocyte marker (GFAP, red) and anti-DAPI (blue). Bar, 100 μm. The boxed area is magnified and the arrow indicates magnified cells. (E,F) The number of GFAP-positive cells and total cells were counted and branch lengths were measured in randomly selected areas from five cultures (means ± SD). p < 0.05; ∗∗p < 0.001 compared with the -bFGF/control siRNA.
FIGURE 3
FIGURE 3
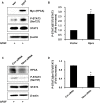
Effect of Hpca on STAT3 (Ser727) activation in HNPCs. (A) HNPCs were transfected with pMSCV-IRES-EGFP or pMSCV-Hpca-myc-IRES-EGFP for 48 h in the presence of bFGF. Proteins were analyzed by western blotting with anti-Myc, anti-p-STAT3 (Ser727), anti-STAT3, and anti-β-actin. (B) Graph shows mean densities as fold increases in three independent experiments (means ± SD). Band intensities were quantified with Quantity Ones® software. p < 0.001 compared with the vector control. (C) Cells were transfected with control siRNA or Hpca siRNA for 72 h. Cell were lysed and analyzed by western blotting with anti-hippocalcin, anti-p-STAT3 (Ser727), anti-STAT3, and anti-β-actin. (D) Graph shows mean densities as fold increases from three independent experiments (means ± SD). p < 0.001 compared with the +bFGF/control siRNA.
FIGURE 4
FIGURE 4
Inhibitory effect of STAT3 (Ser727) activation on astrocytic differentiation of HNPCs. (A) HNPCs were transfected with pMSCV-IRES-EGFP or pMSCV-Hpca-myc-IRES-EGFP for 48 h and then treated with 10 μM S3I-201 for 24 h. Cells were lysed and analyzed by western blotting with anti-Myc, anti-p-STAT3 (Ser727), anti-STAT3, anti-GFAP, and anti-β-actin. (B,C) Graphs show mean densities as fold increases from three independent experiments (means ± SD). Band intensities were quantified with Quantity Ones® software. p < 0.01 compared with the Hpca/DMSO. (D,E) Cells were transfected with pMSCV-IRES-EGFP or pMSCV-Hpca-myc-IRES-EGFP for 48 h and then treated with 10 μM S3I-201 for 24 h. mRNA levels of neurotrophins and proneural bHLH transcription factors were measured by RT-PCR (D) and real-time PCR (E). Graph shows mean densities as fold increases in three independent experiments (means ± SD). p < 0.05; ∗∗p < 0.01 compared with the Hpca/DMSO. (F) Cells were transduced with EGFP vector or Hpca-myc-EGFP for 48 h and then treated with 10 μM S3I-201 for 24 h. Fixed cells were immunostained with anti-GFP (green) and anti-GFAP (red). Bar, 100 μm. The boxed area is magnified and the arrow indicates magnified cells. (G,H) GFAP-positive cells were counted under a fluorescence microscopy and branch lengths were measured in randomly selected areas from five cultures. Data are means ± SD of five values. p < 0.05; ∗∗p < 0.001 compared with the Hpca/DMSO.
FIGURE 5
FIGURE 5
Effect of STAT3 downregulation on astrocytic differentiation of HNPCs. (A) HNPCs were transfected with pMSCV-IRES-EGFP or pMSCV-Hpca-myc-IRES-EGFP for 48 h and then transfected with control siRNA or Stat3 siRNA for 72 h. Proteins were analyzed in western blotting with anti-Myc, anti-p-STAT3 (Ser727), anti-STAT3, anti-GFAP, and anti-GAPDH. (B) Graph shows mean densities as fold increases from three independent experiments (means ± SD). p < 0.01 compared with Hpca/control siRNA. (C,D) mRNA levels of neurotrophins and proneural bHLH transcription factors were analyzed by RT-PCR (C) and real-time PCR (D). Data are means ± SD of three independent experiments. p < 0.05; ∗∗p < 0.01 compared with Hpca/control siRNA. (E) Cells were transduced with EGFP vector or Hpca-myc-EGFP for 48 h and then transfected with control siRNA or Stat3 siRNA for 72 h. Fixed cells were immunostained with anti-GFP (green) and anti-GFAP (red). Bar, 100 μm. (F) Graph shows the percentages of GFAP-positive cells. GFAP-positive cells among GFP-positive cells were counted under fluorescence microscopy. The proportions of GFAP-positive cells were determined in randomly selected areas from five cultures (means ± SD). p < 0.05 compared with the Hpca/control siRNA. (G) Branch lengths were measured in randomly selected areas from five cultures (means ± SD). p < 0.05 compared with the Hpca/control siRNA.

Similar articles

Cited by

References

    1. Amici M., Doherty A., Jo J., Jane D., Cho K., Collingridge G., et al. (2009). Neuronal calcium sensors and synaptic plasticity. Biochem. Soc. Trans. 37(Pt 6) 1359–1363. 10.1042/BST0371359 - DOI - PubMed
    1. Anderson D. J. (2001). Stem cells and pattern formation in the nervous system: the possible versus the actual. Neuron 30 19–35. 10.1016/S0896-6273(01)00260-4 - DOI - PubMed
    1. Aravind P., Chandra K., Reddy P. P., Jeromin A., Chary K. V., Sharma Y. (2008). Regulatory and structural EF-hand motifs of neuronal calcium sensor-1: Mg 2+ modulates Ca 2+ binding, Ca 2+ -induced conformational changes, and equilibrium unfolding transitions. J. Mol. Biol. 376 1100–1115. 10.1016/j.jmb.2007.12.033 - DOI - PubMed
    1. Bonni A., Sun Y., Nadal-Vicens M., Bhatt A., Frank D. A., Rozovsky I., et al. (1997). Regulation of gliogenesis in the central nervous system by the JAK-STAT signaling pathway. Science 278 477–483. 10.1126/science.278.5337.477 - DOI - PubMed
    1. Braunewell K. H., Gundelfinger E. D. (1999). Intracellular neuronal calcium sensor proteins: a family of EF-hand calcium-binding proteins in search of a function. Cell Tissue Res. 295 1–12. 10.1007/s004410051207 - DOI - PubMed

LinkOut - more resources