Review
. 2016:2016:8503859.
doi: 10.1155/2016/8503859. Epub 2016 Oct 20.

Optical Coherence Tomography as a Biomarker for Diagnosis, Progression, and Prognosis of Neurodegenerative Diseases

Affiliations
Review

Optical Coherence Tomography as a Biomarker for Diagnosis, Progression, and Prognosis of Neurodegenerative Diseases

Maria Satue et al. J Ophthalmol. 2016.

Abstract

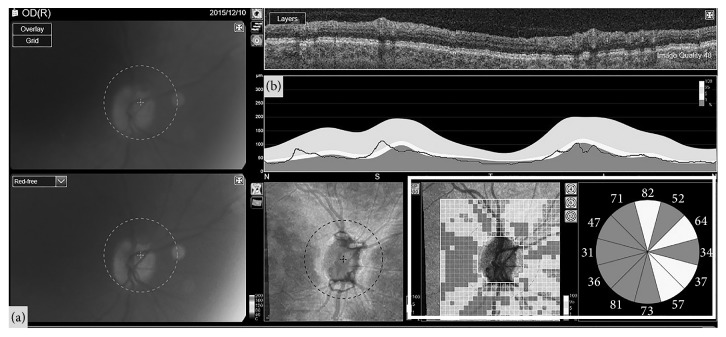
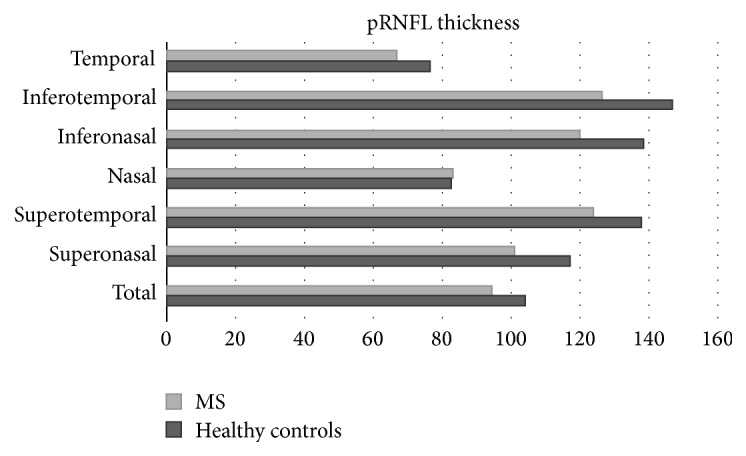
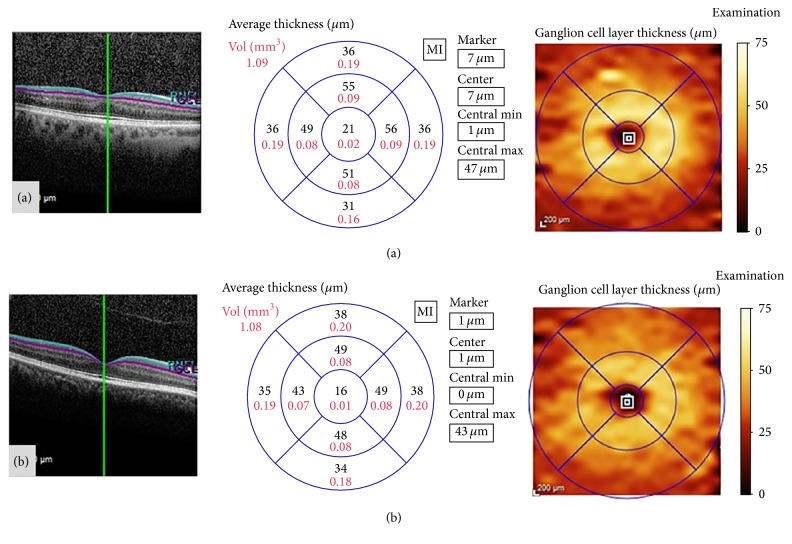
Neurodegenerative diseases present a current challenge for accurate diagnosis and for providing precise prognostic information. Developing imaging biomarkers for multiple sclerosis (MS), Parkinson disease (PD), and Alzheimer's disease (AD) will improve the clinical management of these patients and may be useful for monitoring treatment effectiveness. Recent research using optical coherence tomography (OCT) has demonstrated that parameters provided by this technology may be used as potential biomarkers for MS, PD, and AD. Retinal thinning has been observed in these patients and new segmentation software for the analysis of the different retinal layers may provide accurate information on disease progression and prognosis. In this review we analyze the application of retinal evaluation using OCT technology to provide better understanding of the possible role of the retinal layers thickness as biomarker for the detection of these neurodegenerative pathologies. Current OCT analysis of the retinal nerve fiber layer and, specially, the ganglion cell layer thickness may be considered as a good biomarker for disease diagnosis, severity, and progression.


Figures

Figure 1
Figure 1
Optic nerve head (a) and retinal nerve fiber layer analysis (b) as obtained with swept-source optical coherence tomography in a 43-year-old patient with multiple sclerosis who suffered a previous episode of optic neuritis 5 years ago. The pixel map and the clock sector analysis (marked with the white square) of the optic disc shows important retinal nerve fiber layer loss in most sectors of the peripapillary area.
Figure 2
Figure 2
Mean peripapillary retinal nerve fiber layer (pRNFL) thickness of 100 multiple sclerosis (MS) patients compared with 97 healthy controls, as measured with optical coherence tomography. The peripapillary area is divided into 6 different sectors (superonasal, superotemporal, nasal, inferonasal, inferotemporal, and temporal) and average thickness. All measurements except nasal thickness were found to be significantly reduced in MS patients compared to controls (Garcia-Martin et al., data not published).
Figure 3
Figure 3
Example of segmentation analysis of the different retinal layers, in a cross-sectional linear scan of the macular area (a), obtained with Spectralis optical coherence tomography, in a healthy control (b) and a patient diagnosed with Parkinson disease (c). The marked lines are automatically provided by the segmentation software and represent the different layers of the retina. Corresponding acronyms are also provided by the segmentation software: ILM: inner limiting membrane; GCL: ganglion cell layer; IPL: inner plexiform layer; INL: inner nuclear layer; OPL: outer plexiform layer; ONL: outer nuclear layer; ELM: external limiting membrane; PR: photoreceptors; MB: Bruch's membrane.
Figure 4
Figure 4
Example of segmentation analysis of the macular ganglion cell layer, obtained with Spectralis optical coherence tomography, in a healthy control (a) and a patient diagnosed with Parkinson disease (b). The segmentation report shows the ganglion cell layer thickness (in microns) and total volume (in mm3) of the ETDRS macular area. In this patient (b), the central and inner macular areas present thinning of the ganglion cell layer, compared with the healthy control (a).

References

    1. Huang D., Swanson E. A., Lin C. P., et al. Optical coherence tomography. Science. 1991;254(5035):1178–1181. doi: 10.1126/science.1957169. - DOI - PMC - PubMed
    1. Fujimoto J. G., Brezinski M. E., Tearney G. J., et al. Optical biopsy and imaging using optical coherence tomography. Nature Medicine. 1995;1(9):970–972. doi: 10.1038/nm0995-970. - DOI - PubMed
    1. Garcia-Martin E., Pueyo V., Ara J. R., et al. Effect of optic neuritis on progressive axonal damage in multiple sclerosis patients. Multiple Sclerosis Journal. 2011;17(7):830–837. doi: 10.1177/1352458510397414. - DOI - PubMed
    1. Burgansky-Eliash Z., Wollstein G., Chu T., et al. Optical coherence tomography machine learning classifiers for glaucoma detection: a preliminary study. Investigative Ophthalmology & Visual Science. 2005;46(11):4147–4152. doi: 10.1167/iovs.05-0366. - DOI - PMC - PubMed
    1. García-Martín E., Pueyo V., Martin J., et al. Progressive changes in the retinal nerve fiber layer in patients with multiple sclerosis. European Journal of Ophthalmology. 2010;20(1):167–173. - PubMed

LinkOut - more resources