. 2016 Nov 14:7:13329.
doi: 10.1038/ncomms13329.

Akkermansia muciniphila mediates negative effects of IFNγ on glucose metabolism

Affiliations

Akkermansia muciniphila mediates negative effects of IFNγ on glucose metabolism

Renee L Greer et al. Nat Commun. .

Abstract

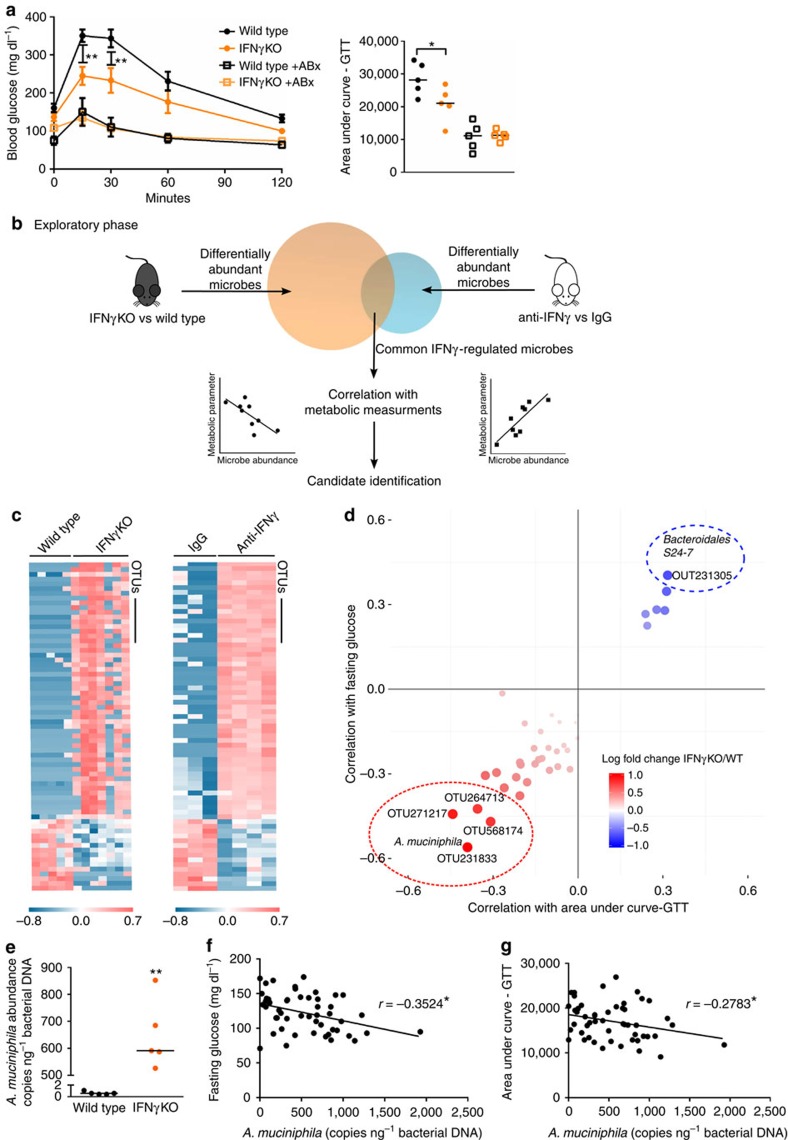
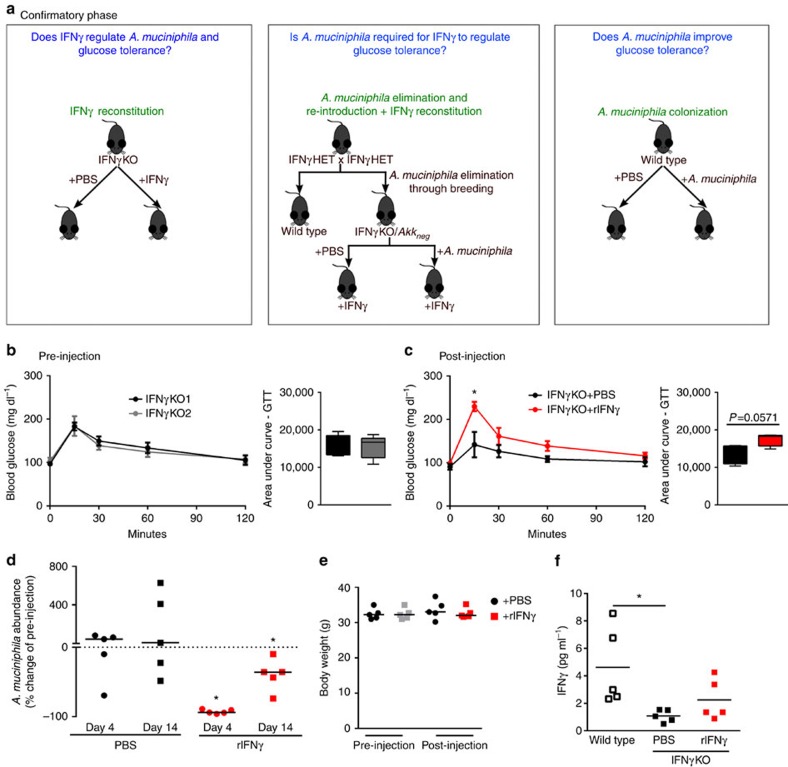
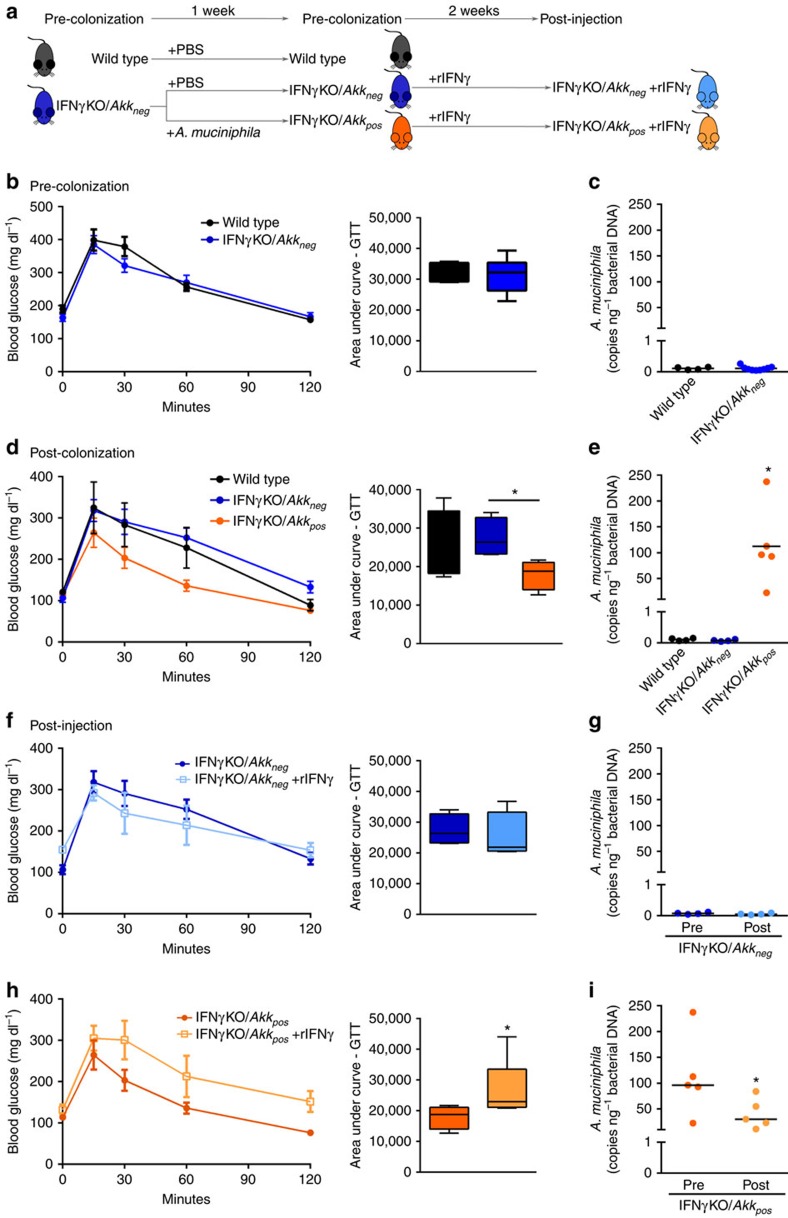
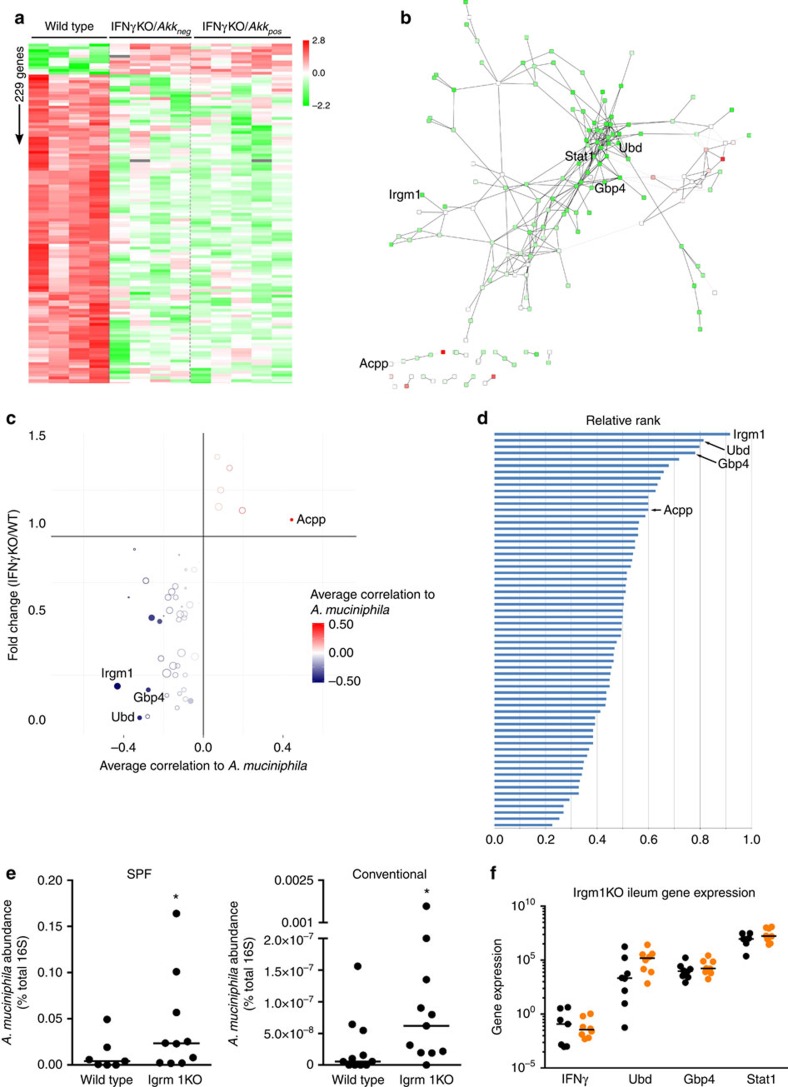
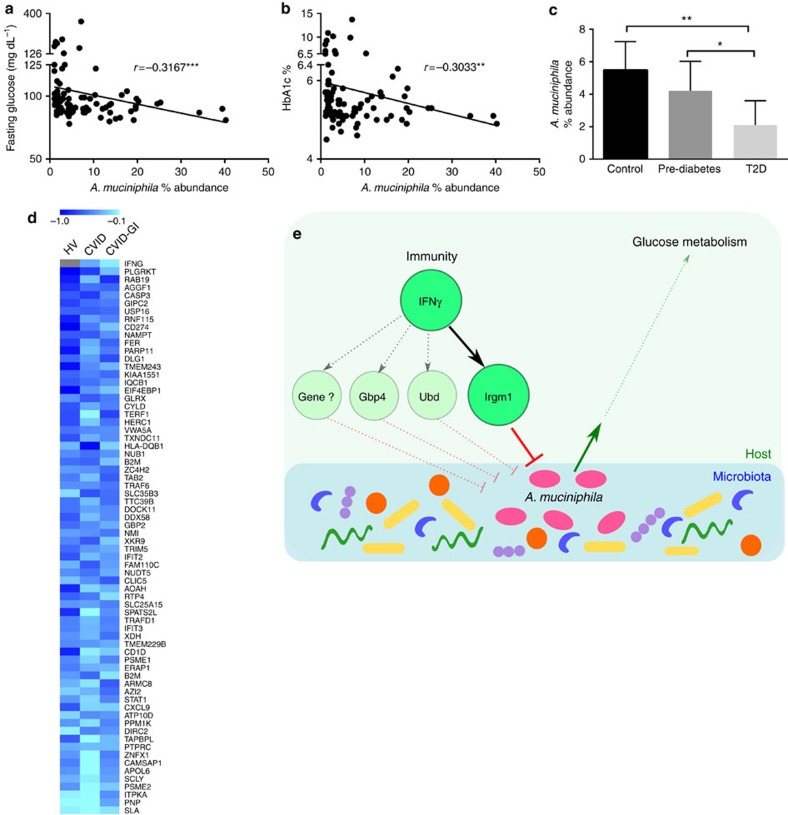
Cross-talk between the gut microbiota and the host immune system regulates host metabolism, and its dysregulation can cause metabolic disease. Here, we show that the gut microbe Akkermansia muciniphila can mediate negative effects of IFNγ on glucose tolerance. In IFNγ-deficient mice, A. muciniphila is significantly increased and restoration of IFNγ levels reduces A. muciniphila abundance. We further show that IFNγ-knockout mice whose microbiota does not contain A. muciniphila do not show improvement in glucose tolerance and adding back A. muciniphila promoted enhanced glucose tolerance. We go on to identify Irgm1 as an IFNγ-regulated gene in the mouse ileum that controls gut A. muciniphila levels. A. muciniphila is also linked to IFNγ-regulated gene expression in the intestine and glucose parameters in humans, suggesting that this trialogue between IFNγ, A. muciniphila and glucose tolerance might be an evolutionally conserved mechanism regulating metabolic health in mice and humans.


Figures

Figure 1
Figure 1. Identification of A. muciniphila as a predicted IFNγ-dependent regulator of glucose tolerance.
(a) Intraperitoneal glucose tolerance test (IP-GTT) and area under the curve quantification in conventional IFNγKO and wild-type control mice before (closed circles) and after (open squares) 2 weeks of antibiotic cocktail treatment (n=5 per group). Glucose tolerance curves shown as mean±s.e.m., median line is displayed on dot plots. (b) Experimental outline describing the exploratory phase for prediction of IFNγ-regulated microbes that are modulators of glucose metabolism. (c) Heat maps of common differentially abundant microbes in IFNγKO versus wild-type stool and anti-IFNγ versus IgG caecal content. Differentially abundant microbes are selected based on t-test FDR<0.1. (d) Correlation of differentially abundant microbes to area under curve of glucose tolerance (AUC-GTT) test and fasting glucose. Colour intensity indicates direction of change of microbe in IFNγKO versus wild type (red=more abundant in IFNγKO). Size of each point indicates Spearman correlation P value with larger spots representing higher significance. Dashed circles indicate P value cutoff of 0.05. All four points within the red circle are unique OTUs, all representing A. muciniphila. (e) Quantification of A. muciniphila copy number by qPCR, represented as copies A. muciniphila genome per ng total 16S DNA. (n=5 per group, one representative experiment out of 3). (f,g) Spearman correlation of A. muciniphila copies per ng bacterial DNA with fasting glucose (f) and area under the curve of glucose tolerance test (g) in IFNγKO mice (n=50). *P<0.05, **P<0.01, ***P<0.001 by one-tailed Mann–Whitney test except where indicated otherwise.
Figure 2
Figure 2. IFNγ reconstitution validates IFNγ as a regulator of A. muciniphila and glucose tolerance.
(a) Experimental outline describing the confirmatory phase where the identified candidate from Fig. 1b exploratory phase, A. muciniphila, is directly tested by three independent approaches. Readouts of all experiments are quantification of A. muciniphila abundance and assessment of glucose tolerance. (b,c) IP-GTT and area under the curve of IFNγKO mice before (b) and following 2 weeks of rIFNγ or PBS administration (c). (d) A. muciniphila was quantified by qPCR. Shown is percent change of A. muciniphila abundance in stool from initial pre-injection levels after the 2-week injection period. (e) Body weight of all groups of mice pre- and post-injection. (f) Serum IFNγ levels at the post-injection time point. Glucose tolerance curves shown as mean±s.e.m., box plots represent median with 25th and 75th percentile borders and error bars represent min–max. Median line is displayed on dot plots. For all glucose tolerance tests and qPCR results shown, n=5 per group. *P<0.05 by one-tailed Mann–Whitney test.
Figure 3
Figure 3. A. muciniphila is required for IFNγ regulation of glucose tolerance.
(a) Experimental scheme: A. muciniphila-negative wild-type and IFNγKO mice were colonized with either PBS or A. muciniphila and subsequently injected with recombinant IFNγ (rIFNγ). (b,d) Pre-colonization (b) and post-colonization (d) IP-GTT. (c,e) Pre-colonization (c) and post-colonization (e) A. muciniphila levels by qPCR expressed as copies of A. muciniphila per ng total bacterial DNA. (f,h) IP-GTT in IFNγKO/Akkneg(f) and IFNγKO/Akkpos (h) before and after 2 weeks of injection with rIFNγ. Darker shades represent before injection and represent the same test shown in d for each respective group; lighter shades represent after injection. (g,i) A. muciniphila levels by qPCR expressed as copies of A. muciniphila per ng total bacterial DNA in IFNγKO/Akkneg (g) and IFNγKO/Akkpos (i) before and after 2 weeks of injection with rIFNγ. Darker shades represent before injection, lighter shades represent after injection. Glucose tolerance curves shown as mean±s.e.m., box plots represent median with 25th and 75th percentile borders and error bars represent min–max. Median line is displayed on dot plots. At pre-colonization time point n=4 for wild type and 9 for IFNγKO/Akkneg. At post-colonization and post-injection time points, n=4 for wild type and IFNγKO/Akkneg and 5 for IFNγKO/Akkpos. *P<0.05 by one-tailed Mann–Whitney test.
Figure 4
Figure 4. IFNγ regulates A. muciniphila abundance through Irgm1.
(a) Heat map of transcript abundance of IFNγ-dependent genes. Genes that show differential abundance between wild type and IFNγKO (t-test FDR<0.1), but no difference between IFNγKO/Akkneg and IFNγKO/Akkpos (t-test FDR<0.1) are shown. (b) Network reconstruction of IFNγ-dependent genes shown in a. Colours indicate fold change of expression as indicated in a. A file containing complete information for this network is available for download upon request. (c) Correlation of IFNγ-dependent genes with A. muciniphila levels. Pearson correlation between ileum A. muciniphila abundance and gene expression were calculated in three groups separately and the average correlation coefficient was shown. Colour intensity of each point indicates strength of correlation to A. muciniphila levels. Size of each point indicates average shortest path length, with larger points representing longer paths. (d) Ranking of IFNγ-dependent genes as potential regulators of A. muciniphila. Ranking takes into account strength of correlation with A. muciniphila and average shortest path length, with longer path lengths (that is, more peripheral to the network) resulting in higher ranking scores. See ‘Methods' section for a more detailed description of calculation of this rank score. (e) A. muciniphila abundance in Irgm1KO mice housed in specific pathogen free conditions (n=7 wild type, 10 Irgm1KO) and conventional conditions (n=11 per genotype) by qPCR, represented as per cent A. muciniphila of total 16S rRNA DNA. (f) Gene expression of top IFNγ-dependent candidate genes from d determined by RNA-seq in the Irgm1KO ileum under specific pathogen free conditions; n=7 wild type (black symbols), 10 Irgm1KO (orange symbols). Acpp, acid phosphatase, prostate; Gbp4, guanylate binding protein 4; Irgm1, immunity-related GTPase family, M; Stat1, signal transducer and activator of transcription 1; SPF, Specific pathogen free; Ubd, Ubiquitin D. Median line displayed on dot plots. *P<0.05 by one-tailed Mann–Whitney test.
Figure 5
Figure 5. A. muciniphila correlates to glucose measures in human subjects and is reduced in diabetic patients.
(a,b) Spearman correlation of A. muciniphila percent abundance with fasting glucose (a) and HbA1c (b) in participants in the Advento Study (n=94) (c) A. muciniphila percent abundance in normal (n=58), pre-diabetic (n=31) and type 2 diabetic subjects (n=11). Bar plot represents mean and 95% confidence interval. Significance assessed by one-tailed Mann–Whitney test. (d) Heat map of Pearson correlation coefficients between each individual IFNγ-dependent gene and abundance of A. muciniphila of duodenal biopsies in three groups of samples. Individual P value<0.2, combined FDR<0.1 for 59 out of 69 genes (Supplementary Data 6); genes ranked by strength of correlation according to Fisher's combined probability test. Grey colour indicates that a gene was below the level of detection. *P<0.05, **P<0.01, ***P<0.001. (e) Graphical model for regulation of glucose metabolism by IFNγ through the microbiota. IFNγ regulates expression of genes such as Irgm1 and Gbp4, which in turn, contribute to regulation of A. muciniphila levels in the gut. Differences in A. muciniphila abundance ultimately result in differences in systemic glucose tolerance in the host, with higher abundance of A. muciniphila inducing improvement of tolerance. CVID, Common Variable Immunodeficiency; CVID-GI, CVID with gastrointestinal symptoms; HV, healthy volunteer.

Comment in

References

    1. Donath M. Y. & Shoelson S. E. Type 2 diabetes as an inflammatory disease. Nat. Rev. Immunol. 11, 98–107 (2011). - PubMed
    1. Nishimura S. et al. CD8+ effector T cells contribute to macrophage recruitment and adipose tissue inflammation in obesity. Nat. Med. 15, 914–920 (2009). - PubMed
    1. Lumeng C. N., Bodzin J. L. & Saltiel A. R. Obesity induces a phenotypic switch in adipose tissue macrophage polarization. J. Clin. Invest. 117, 175–184 (2007). - PMC - PubMed
    1. Feuerer M. et al. Lean, but not obese, fat is enriched for a unique population of regulatory T cells that affect metabolic parameters. Nat. Med. 15, 930–939 (2009). - PMC - PubMed
    1. Duffaut C., Galitzky J., Lafontan M. & Bouloumie A. Unexpected trafficking of immune cells within the adipose tissue during the onset of obesity. Biochem. Biophys. Res. Commun. 384, 482–485 (2009). - PubMed

Publication types

LinkOut - more resources