. 2016 Nov 14:6:37021.
doi: 10.1038/srep37021.

HIV-1 Nef sequesters MHC-I intracellularly by targeting early stages of endocytosis and recycling

Affiliations

HIV-1 Nef sequesters MHC-I intracellularly by targeting early stages of endocytosis and recycling

Brennan S Dirk et al. Sci Rep. .

Abstract

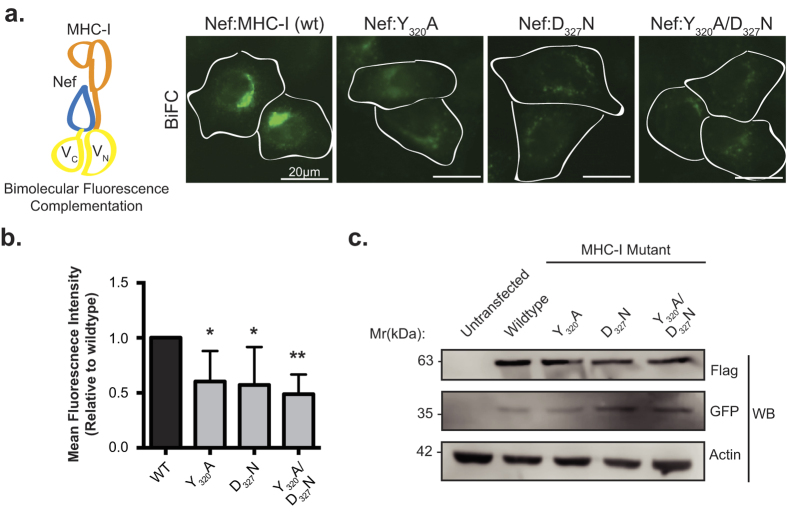
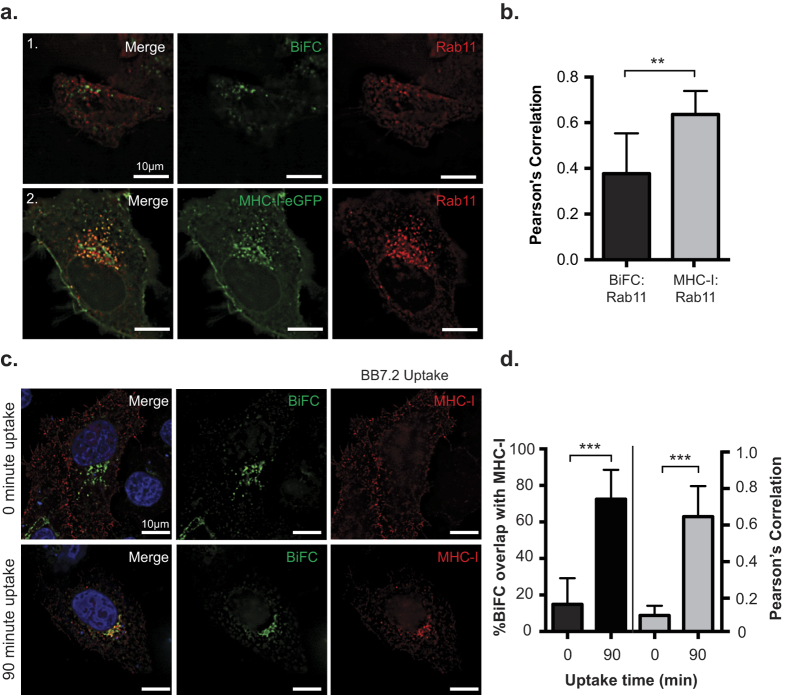
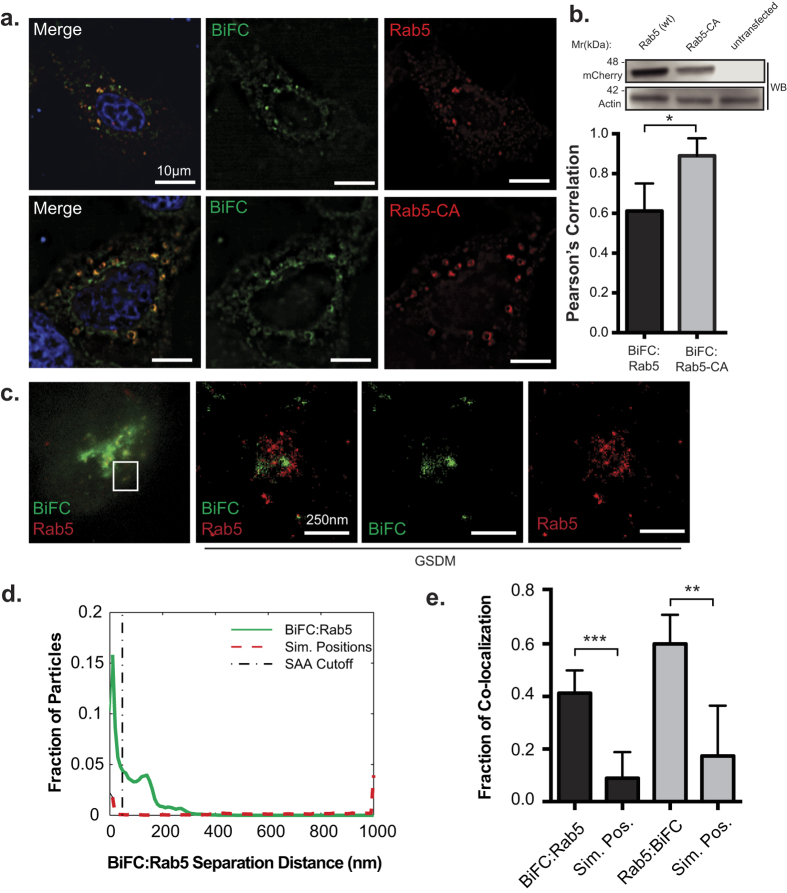
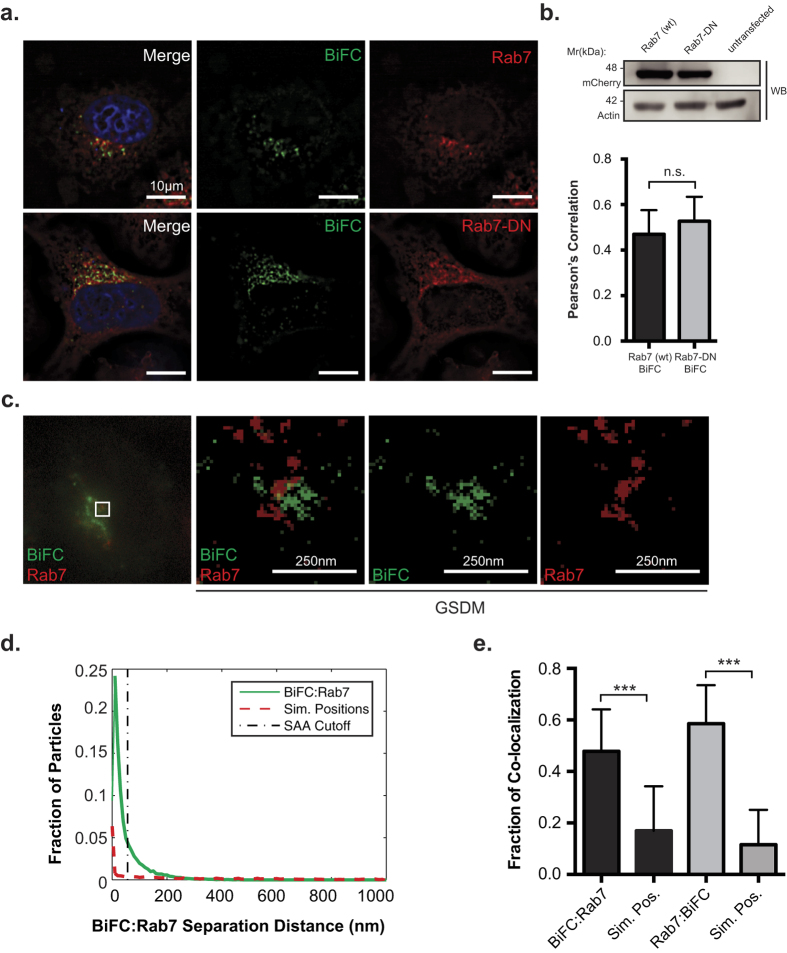
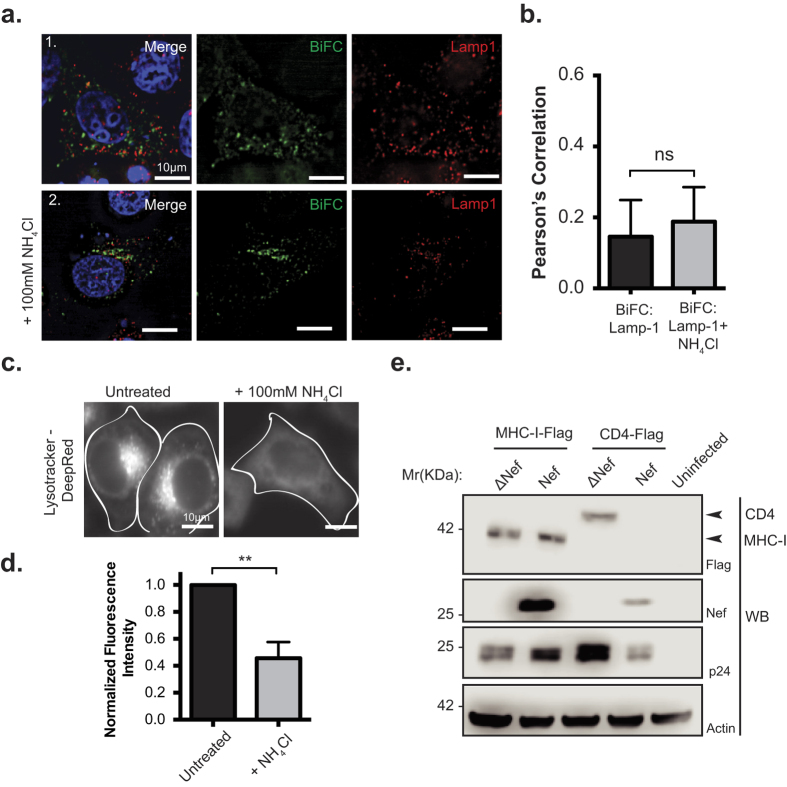
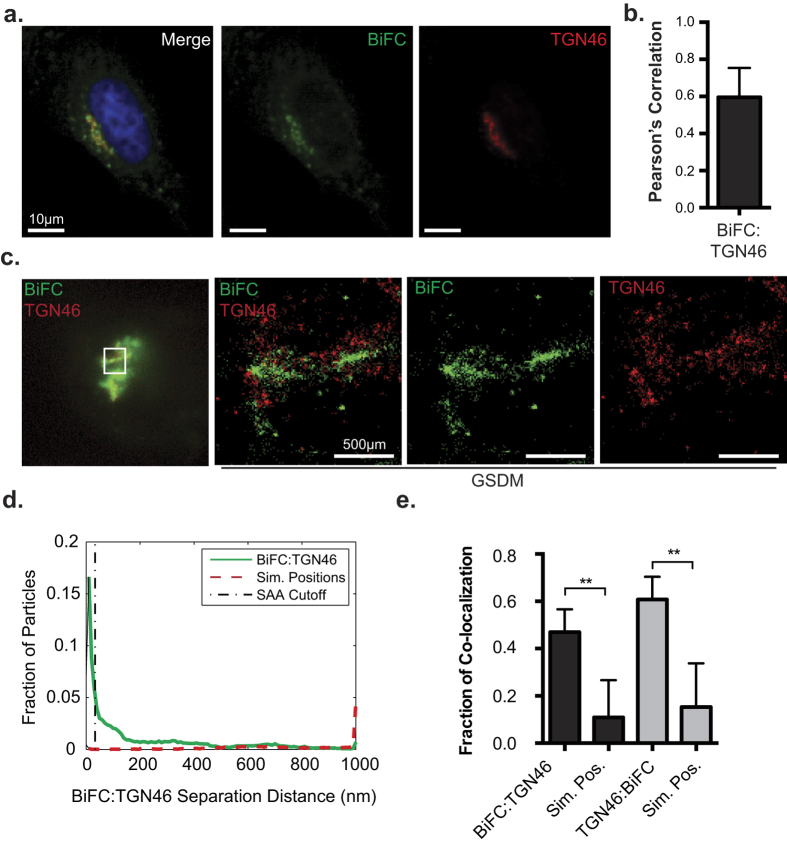
A defining characteristic of HIV-1 infection is the ability of the virus to persist within the host. Specifically, MHC-I downregulation by the HIV-1 accessory protein Nef is of critical importance in preventing infected cells from cytotoxic T-cell mediated killing. Nef downregulates MHC-I by modulating the host membrane trafficking machinery, resulting in the endocytosis and eventual sequestration of MHC-I within the cell. In the current report, we utilized the intracellular protein-protein interaction reporter system, bimolecular fluorescence complementation (BiFC), in combination with super-resolution microscopy, to track the Nef/MHC-I interaction and determine its subcellular localization in cells. We demonstrate that this interaction occurs upon Nef binding the MHC-I cytoplasmic tail early during endocytosis in a Rab5-positive endosome. Disruption of early endosome regulation inhibited Nef-dependent MHC-I downregulation, demonstrating that Nef hijacks the early endosome to sequester MHC-I within the cell. Furthermore, super-resolution imaging identified that the Nef:MHC-I BiFC complex transits through both early and late endosomes before ultimately residing at the trans-Golgi network. Together we demonstrate the importance of the early stages of the endocytic network in the removal of MHC-I from the cell surface and its re-localization within the cell, which allows HIV-1 to optimally evade host immune responses.


Figures

Figure 1
Figure 1. Bimolecular fluorescence complementation is observed between Nef and MHC-I.
(a) Left: Schematic representation of the BiFC reporter system. Right: Nef-VC and either wildtype MHC-I-VN-Flag or the indicated mutants were transfected into HeLa cells, 24 hrs later cells were fixed, and BiFC fluorescence (green) was observed under the FITC channel. Scale bars represent 20 μm. (b) Fluorescence intensities of Nef and MHC-I-VN-Flag positive cells were quantified in ImageJ, minus the background signal, to observe a decrease in fluorescence in the presence of the MHC-I mutations (n = 100, *indicates p-value < 0.05, **indicates p-value < 0.01). (c) Flag and GFP specific Western blots were conducted to ensure equal expression of both the MHC-I-VN-Flag mutants and Nef-VC, respectively. An actin specific Western blot was conducted as a loading control.
Figure 2
Figure 2. Nef prevents MHC-I from entering into a Rab11 dependent recycling route.
(a) MHC-I-eGFP (panel 1) or Nef-VC and MHC-I-VN-Flag (panel 2) and dsRed-Rab11 were co-transfected into HeLa cells. 24 hrs post transfection, cells were fixed and mounted onto coverslips. GFP and BiFC fluorescence was observed under the FITC channel, and dsRed-Rab11a was observed under the Cy3 channel. (b) Co-localization was quantified by using the Pearson’s correlation through the JaCoP Plug-in on ImageJ. (c) MHC-I (BB7.2) uptake experiments were performed as described in the materials and methods. BiFC signal is visualized in green, and MHC-I uptake was pseudocolored in red, nuclei were counterstained in blue. (d) Percent of co-localization (left axis and black bars), and Pearson’s correlation (right axis and grey bars) were determined using the Mander’s and Pearson’s correlation respectively through the JaCoP Plug-in on ImageJ. Error bars were calculated by quantification of at least 50 cells between 3 independent experiments. (**Indicates p-value < 0.01, ***indicates p-value < 0.001).
Figure 3
Figure 3. Nef:MHC-I interaction occurs within Rab5-positive early endosomes.
(a) HeLa cells were co-transfected with plasmids encoding Nef-VC, MHC-I-VN-Flag and the indicated mCherry-tagged Rab5 constructs (wildtype and constitutively active (CA)). Twenty-four hours post transfection cells were fixed and mounted with DAPI Fluoromount-G. BiFC fluorescence (green) was detected under the FITC channel, while the mCherry-tagged Rab5 constructs were visualized under the Cy3 filter settings. Nuclei were visualized under the DAPI channel (scale bars represent 10 μm). (b) Co-localization of Nef:MHC-I BiFC with the mCherry tagged Rab5 constructs was quantified by the Pearson’s correlation through the JaCoP Plug-in on ImageJ. Error bars were calculated by quantification of at least 25 cells between 3 independent experiments (*Indicates p-value < 0.05). Western blot analysis for mCherry to confirm expression levels of Rab5 and Rab5-CA, with actin as a loading control (c) Cells were transfected with Nef-VC and MHC-I-VN-Flag and immunostained for Rab5 and subsequently imaged utilizing ground state depletion microscopy (GSDM). (d) A histogram plotting the intermolecular distances between the nearest neighbor, representing either BiFC:Rab5 (Solid line) or BiFC:Simulated random positions (Sim. Positions; Dashed line). (e) A graphical representation of the fraction of co-localized particles observed in (d) which were observed to be under the cut-off value of ~40 nm. Error bars were calculated by quantification of 10 cells in 3 independent experiments (**indicates p-value < 0.01, ***indicates p-value < 0.001).
Figure 4
Figure 4. Nef:MHC-I interaction occurs within Rab7-positive late endosomes.
(a) HeLa cells were co-transfected with Nef-VC and MHC-I-VN-Flag encoding constructs along with constructs encoding wildtype mCherry-Rab7 or dominant negative mCherry-Rab7 (mCherry-Rab7-DN). BiFC fluorescence (green) was visualized under the FITC channel, mCherry-Rab7 (red) was detected under the Cy3 channel. Nuclei were stained with DAPI (scale bars represent 10 μm). (b) Co-localization was quantified by using the Pearson’s correlation through the JaCoP Plug-in on ImageJ. Error bars were calculated by quantification of at least 40 cells between 3 independent experiments. Western blot analysis for mCherry to confirm expression levels of Rab7 and Rab7-DN, with actin as a loading control. (c) Cells were transfected with Nef-VC and MHC-I-VN-Flag and immunostained for Rab7 and subsequently imaged utilizing ground state depletion microscopy (GSDM). (d) A histogram plotting the intermolecular distances between the nearest neighbor, representing either BiFC:Rab7 (Solid line) or BiFC:Simulated random positions (Sim. Positions; Dashed line). (e) A graphical representation of the fraction of co-localized particles observed in (d) which were observed to be under the cut-off value of ~40 nm. Error bars were calculated by quantification at least 10 cells in 3 independent experiments (**indicates p-value < 0.01, ***indicates p-value < 0.001).
Figure 5
Figure 5. Nef:MHC-I interaction does not occur in lysosomes.
(a) HeLa cells were co-transfected with Nef-VC and MHC-I-VN-Flag constructs and immunostained for LAMP-1 (Panel 1), or, treated with 100 mM ammonium chloride (NH4Cl) for 3 hours prior to fixation and staining (Panel 2). BiFC fluorescence (green) was visualized under the FITC channel, whereas LAMP-1 stain was visualized under the Cy5 filter settings, and pseudo-colored red. Nuclei were stained with DAPI, and scale bars represent 10 μm. (b) Co-localization was quantified by the Pearson’s Correlation through the JaCoP Plug-in on ImageJ. Error bars were calculated by quantification of at least 25 cells between 3 independent experiments. (c,d) HeLa cells were treated with PBS, or 100 mM of ammonium chloride for 3 hours, and then treated with 10 μM Lysotracker Deep Red for 5 minutes. Live cells were then imaged at 37 °C in 5% CO2 and quantified for Lystotracker fluorescence. Error bars were calculated by quantification of at least 25 cells between 3 independent experiments. (**Indicates p-value < 0.01). (e) Sup-T1 cells were infected with F2A MHC-I-Flag-Nef/ΔNef or F2A-CD4-Flag-ΔVpu-Nef/ΔNef viruses. 48 hours post infection, cells were lysed and analyzed by Western blot. Anti-Flag detected total MHC-I-Flag and CD4-Flag, whereas anti-Nef antibody marked the presence or absence of Nef. Anti-p24 and anti-actin antibodies were used as infection and loading controls, respectively. A representative Western blot from 3 independent experiments is shown.
Figure 6
Figure 6. Nef targets MHC-I for sequestration within the trans-Golgi network.
(a) Nef-VC and MHC-I-VN-Flag were transfected into HeLa cells, and 24 hours later fixed and immunostained for TGN46. BiFC fluorescence (green) was observed under the FITC channel, and TGN46 (red) was observed under the Far-Red filters. (b) Co-localization was quantified by using the Pearson’s correlation through the JaCoP Plug-in on ImageJ. Error bars were calculated by quantification of at least 25 cells between 3 independent experiments. (*Indicates p-value < 0.05). (c) Cells were prepared as in (a) and imaged utilizing GSDM; scale bars represent 500 nm. (d) A histogram plotting the distance between the nearest neighbor, representing BiFC:TGN46 (Solid line) or BiFC:Simulated random positions (Sim. Positions; Dashed line). (e) A graphical representation of the fraction of co-localized particles observed in (d) which were observed to be under the cut-off value of ~40 nm. Error bars were calculated by quantification of 8 cells in 2 independent experiments (**indicates p-value < 0.01, ***indicates p-value < 0.001).

References

    1. Malim M. H. & Emerman M. HIV-1 accessory proteins--ensuring viral survival in a hostile environment. Cell Host Microbe 3, 388–398, doi: S1931–3128(08)00126-1 (2008). - PubMed
    1. Dikeakos J. D. et al.. An interdomain binding site on HIV-1 Nef interacts with PACS-1 and PACS-2 on endosomes to down-regulate MHC-I. Molecular Biology of the Cell 23, 2184–2197, doi: mbc.E11-11-0928 (2012). - PMC - PubMed
    1. Blagoveshchenskaya A. D., Thomas L., Feliciangeli S. F., Hung C. H. & Thomas G. HIV-1 Nef downregulates MHC-I by a PACS-1- and PI3K-regulated ARF6 endocytic pathway. Cell 111, 853–866, doi: S0092867402011625 (2002). - PubMed
    1. Collins D. R. & Collins K. L. HIV-1 accessory proteins adapt cellular adaptors to facilitate immune evasion. PLoS Pathog 10, e1003851 (2014). - PMC - PubMed
    1. Collins K. L., Chen B. K., Kalams S. A., Walker B. D. & Baltimore D. HIV-1 Nef protein protects infected primary cells against killing by cytotoxic T lymphocytes. Nature 391, 397–401, doi: 10.1038/34929 (1998). - DOI - PubMed

Publication types

MeSH terms

Substances

Grants and funding