

Geographic Distributions in Hypertension Diagnosis, Measurement, Prevalence, Awareness, Treatment and Control Rates among Middle-aged and Older Adults in China
- PMID: 27841326
- PMCID: PMC5107929
- DOI: 10.1038/srep37020
Geographic Distributions in Hypertension Diagnosis, Measurement, Prevalence, Awareness, Treatment and Control Rates among Middle-aged and Older Adults in China
Abstract
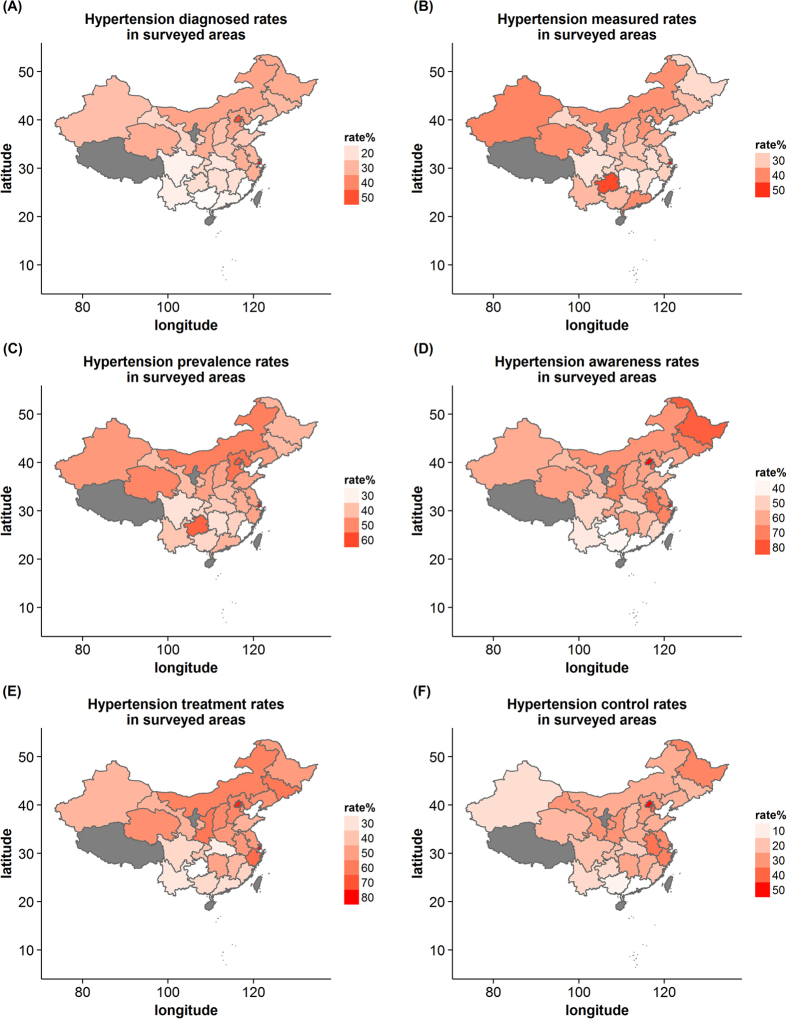
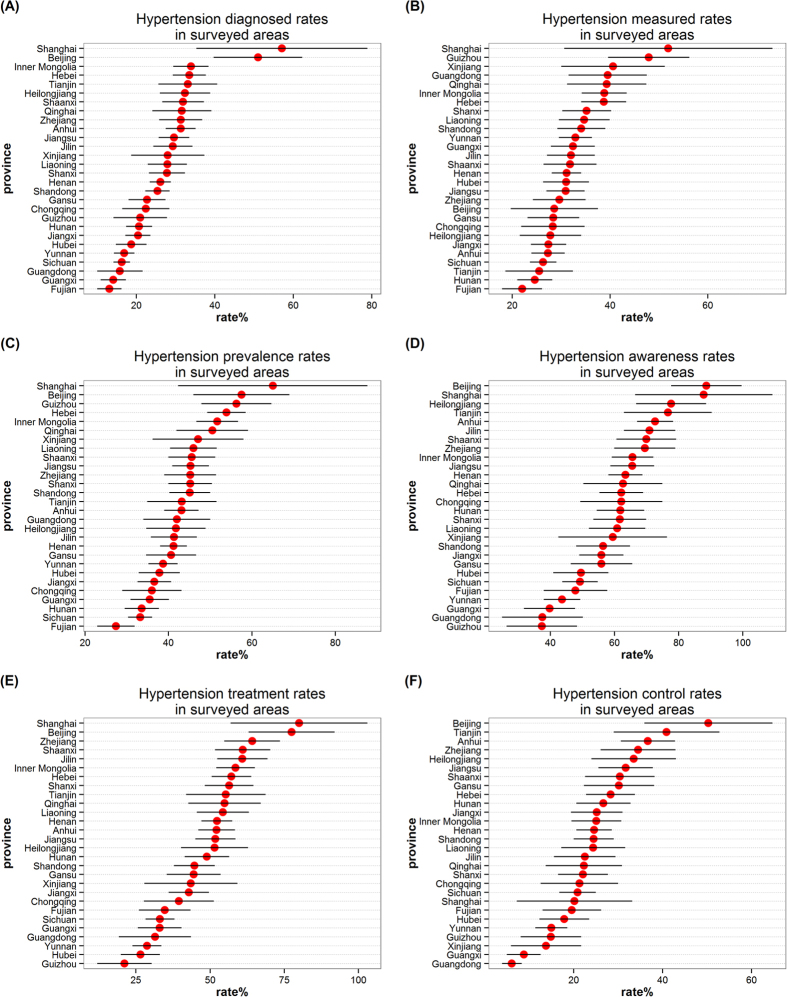
Hypertension is of public health importance in China, but information on geographic distribution on hypertension by map visualization is limited for middle-aged and older adults. Regional geographic variations remain unexplained. Our study is to present geographic distributions at the provincial level and identify provinces and municipalities with high hypertension diagnosis, measurement and prevalence rates and/or low awareness, treatment, control rates among aged 45+ adults in China. We used data collected from the China Health and Retirement Longitudinal Study (n = 13,583) of Chinese people aged 45 years or older. We used weighted rates for our analysis. The rates by provinces and municipalities were compared using map visualization, and explore the main factors of the disparity using ordinal logistic regression. Higher hypertension prevalence rates (56.3%) but lower hypertension awareness, treatment and control rates (37.3%, 21.1% and 14.9%, respectively) were observed in Guizhou. Shanghai and Beijing had the highest hypertension prevalence, awareness and treatment rates (65.0%, 87.8% and 80.0% for Shanghai, 57.5%, 88.6% and 77.5% for Beijing, respectively). Remarkable variations were observed among surveyed provinces and municipalities. Several Chinese regions show particularly higher prevalence rates and/or lack of hypertension awareness and poor control.
Figures
References
-
- Alwan A. Global status report on noncommunicable diseases 2010. (World Health Organization, 2011).
-
- Wen W. et al. Summary of report on cardiovascular diseases in China, 2012. Biomedical and Environmental Sciences 7, 552–558 (2014). - PubMed
-
- Collaboration P. S. Age-specific relevance of usual blood pressure to vascular mortality: a meta-analysis of individual data for one million adults in 61 prospective studies. The Lancet 360, 1903–1913 (2002). - PubMed
-
- Kearney P. M. et al. Global burden of hypertension: analysis of worldwide data. The Lancet 365, 217–223 (2005). - PubMed
Publication types
MeSH terms
Substances
LinkOut - more resources
Full Text Sources
Other Literature Sources
Medical
