. 2016 Nov 14:6:37104.
doi: 10.1038/srep37104.

Glycinergic dysfunction in a subpopulation of dorsal horn interneurons in a rat model of neuropathic pain

Affiliations

Glycinergic dysfunction in a subpopulation of dorsal horn interneurons in a rat model of neuropathic pain

Wendy L Imlach et al. Sci Rep. .

Abstract

The development of neuropathic pain involves persistent changes in signalling within pain pathways. Reduced inhibitory signalling in the spinal cord following nerve-injury has been used to explain sensory signs of neuropathic pain but specific circuits that lose inhibitory input have not been identified. This study shows a specific population of spinal cord interneurons, radial neurons, lose glycinergic inhibitory input in a rat partial sciatic nerve ligation (PNL) model of neuropathic pain. Radial neurons are excitatory neurons located in lamina II of the dorsal horn, and are readily identified by their morphology. The amplitude of electrically-evoked glycinergic inhibitory post-synaptic currents (eIPSCs) was greatly reduced in radial neurons following nerve-injury associated with increased paired-pulse ratio. There was also a reduction in frequency of spontaneous IPSCs (sIPSCs) and miniature IPSCs (mIPSC) in radial neurons without significantly affecting mIPSC amplitude. A subtype selective receptor antagonist and western blots established reversion to expression of the immature glycine receptor subunit GlyRα2 in radial neurons after PNL, consistent with slowed decay times of IPSCs. This study has important implications as it identifies a glycinergic synaptic connection in a specific population of dorsal horn neurons where loss of inhibitory signalling may contribute to signs of neuropathic pain.


Figures
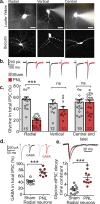
Figure 1
Figure 1. Glycinergic neurotransmission is reduced in radial neurons of superficial dorsal horn after PNL.
(a) Neurons were classified by their morphology. Micrographs show representative examples of lucifer yellow filled neurons immediately following electrophysiological recording (top row) and biocytin filled neurons imaged by confocal microscopy (bottom row). All cells are shown in the parasagittal plane and the scale bar = 10 μm. (b) Examples of glycine-mediated eIPSC traces from control (sham, grey) and nerve-injured (PNL, red) spinal cord neurons. (c) Normalized glycinergic eIPSC values as a percentage of the total eIPSC for the neuron types (***p < 0.001, two way ANOVA, Sidak post-hoc multiple comparisons test). (d) Representative traces of total eIPSCs and GABA eIPSCs, respectively, from radial neurons of sham (grey, black) and PNL (pink, red) animals. Normalized GABA eIPSC values as a percentage of the total eIPSC from radial neurons of control and nerve injured animals. ***p < 0.001 (unpaired t test). (e) Representative traces from radial cells of control (black) and nerve-injured (red) animals with amplitudes normalized to the first pulse and fitted decay exponential shown in grey. Comparison of glycinergic eIPSC decay time constant from control and nerve injured groups (n =10 for each group) ***p < 0.001 (unpaired t tests).
Figure 2
Figure 2. Bicuculline and picrotoxin have similar inhibitory effects on radial neuron eIPSCs.
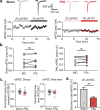
(a) Representative traces from a radial neuron superfused with 20 μM bicuculline (BIC) followed by 80 μM picrotoxin (PIC) from sham (grey, black) or PNL (pink, red) with plots showing eIPSC amplitude over time. (b) Amplitude of eIPSCs in the presence of bicuculline followed by picrotoxin for sham (grey, n = 8) and PNL (pink/red, n = 9) radial neurons. (c) Decay time constant of radial neuron eIPSCs following picrotoxin treatment normalized to the time constant following bicuculline treatment for sham (n = 8) and PNL (n = 9). Rise time of radial neuron eIPSCs following picrotoxin treatment normalized to the rise time following bicuculline treatment for sham (n = 8) and PNL (n = 9). (d). Normalized glycinergic eIPSC values (using bicuculline) as a percentage of the total eIPSC (n = 7 for each group). (*p < 0.05, paired t test).
Figure 3
Figure 3. Glycinergic paired-pulse ratio (PPR) increases in radial neurons and more stimulus is required to elicit a response after PNL.
(a) Representative traces of glycinergic eIPSCs from radial neurons of control (sham, black) and nerve-injured (PNL, red) animals with amplitudes normalized to the first pulse. Scatter dot plot showing data for PPR from control (n = 6) and nerve-injured (n = 8) groups (*p < 0.05, unpaired t test). (b) Input-output curve showing reduced glycinergic transmission in radial cells from nerve-injured spinal cord at all voltages (*p < 0.05, unpaired t test at each voltage value).
Figure 4
Figure 4. PNL reduces sIPSC frequency and increases decay time in radial neurons.
(a) Glycinergic sIPSC frequency of radial, vertical and central/islet cells from dorsal horn of control and nerve-injured animals (**p < 0.01, unpaired t tests). (b) Representative traces of glycinergic sIPSCs from control and nerve-injured radial neurons over a three minute period. (c) Amplitude histograms showing distribution of glycinergic sIPSC amplitudes over a 5 minute period for radial neurons from control and nerve-injured animals (n = 10 per group). Mean amplitudes for each cell are shown in the inset. (d) Representative traces of sIPSC events (average of 10 events) from control and nerve injured animals with fitted exponential shown in grey and a plot of decay time constants for both treatment groups (n = 10 per group). ***p < 0.001 (unpaired t tests).
Figure 5
Figure 5. Frequency of mIPSCs in radial neurons are reduced after PNL.
(a) Representative traces of glycinergic mIPSCs from radial neurons of control (black) and nerve-injured (red) animals over a 10 second period. (b) Cumulative probability distribution of glycinergic mIPSC amplitudes of all recordings (n = 10 for each group), with scatter dot plot showing average mIPSC amplitude from each recording (inset). (c) Histogram showing distribution of mIPSC amplitude over a 5 minute period for control and nerve injured groups (n = 10 per group). (d) Cumulative probability distribution of glycinergic mIPSC inter-event intervals of all recordings (n = 10 for each group), with scatter dot plot showing average mISPC frequency of each recording (inset). (e) Representative traces of single mIPSC events from control and nerve-injured animals with fitted exponential shown in grey and a scatter dot plot of decay time constants for both treatment groups (n = 10 per group). **p < 0.01; ***p < 0.001 (unpaired t tests).
Figure 6
Figure 6. Reduction in eIPSC is not due to EP receptor activation by PGE2.
(a) Time plot showing glycinergic eIPSC amplitude in the presence of the EP receptor antagonist PF-04418948, followed by PGE2. (b) Histograms show normalized glycinergic eIPSC in response to PF-04418948 and (c) in response to PGE2 in the absence of the EP antagonist. *p < 0.05 (paired t tests).
Figure 7
Figure 7. Cyclothiazide decreases glycinergic eIPSC amplitude in radial cells from nerve-injured animals.
(a) Western blot detection of GlyRα2 from membrane proteins from the lumbar dorsal horn of control and nerve-injured animals. Actin is used as a loading control. Scatter dot plot shows densitometry of GlyRα2 western blot bands normalized to the loading control and then the sham control. **p < 0.01 (unpaired t test). Full length blots are presented in Supplementary Figure 1. (b) Time plot showing normalized glycinergic eIPSC amplitudes from radial cells of control (red) and nerve injured (grey) animals in response to cylclothiazide (CTZ). Darker filled circles show time points where drug is superfused. Mean taken between 2–4 minutes (baseline) and 8–10 minutes (CTZ), normalized to the first 5 minutes of recording. (c) Plots of eIPSC response to CTZ from control and nerve-injured tissue. ***p < 0.001 (two way ANOVA with Tukey multiple comparisons test). (d) Representative trace and dot plot showing decrease in decay time following application of CTZ in radial cells from nerve-injured animals.**p < 0.01 (paired t tests).
Figure 8
Figure 8. Schematic showing recording configurations used in this study and main findings.
Inhibitory neurons in lamina III were stimulated and synaptic currents in lamina II interneurons were recorded. Results show a decrease in the probability of glycine release from glycinergic neurons that synapse with radial neurons, as well as a switch to GlyRα2 subunits in radial neurons.

References

    1. Costigan M., Scholz J. & Woolf C. J. Neuropathic pain: a maladaptive response of the nervous system to damage. Annu Rev Neurosci. 32, 1–32 (2009). - PMC - PubMed
    1. Niikura K., Narita M., Butelman E. R., Kreek M. J. & Suzuki T. Neuropathic and chronic pain stimuli downregulate central mu-opioid and dopaminergic transmission. Trends Pharmacol Sci. 31, 299–305 (2010). - PubMed
    1. Gilron I., Baron R. & Jensen T. Neuropathic pain: principles of diagnosis and treatment. Mayo Clin Proc. 90, 532–545 (2015). - PubMed
    1. Todd A. J. Neuronal circuitry for pain processing in the dorsal horn. Nat Rev Neurosci. 11, 823–836 (2010). - PMC - PubMed
    1. Grudt T. J. & Perl E. R. Correlations between neuronal morphology and electrophysiological features in the rodent superficial dorsal horn. J Physiol. 540, 189–207 (2002). - PMC - PubMed

Publication types