. 2016 Oct;12(4):194-216.
doi: 10.1080/15476278.2016.1252887. Epub 2016 Nov 14.

Par-1b is required for morphogenesis and differentiation of myoepithelial cells during salivary gland development

Affiliations

Par-1b is required for morphogenesis and differentiation of myoepithelial cells during salivary gland development

Elise M Gervais et al. Organogenesis. 2016 Oct.

Abstract

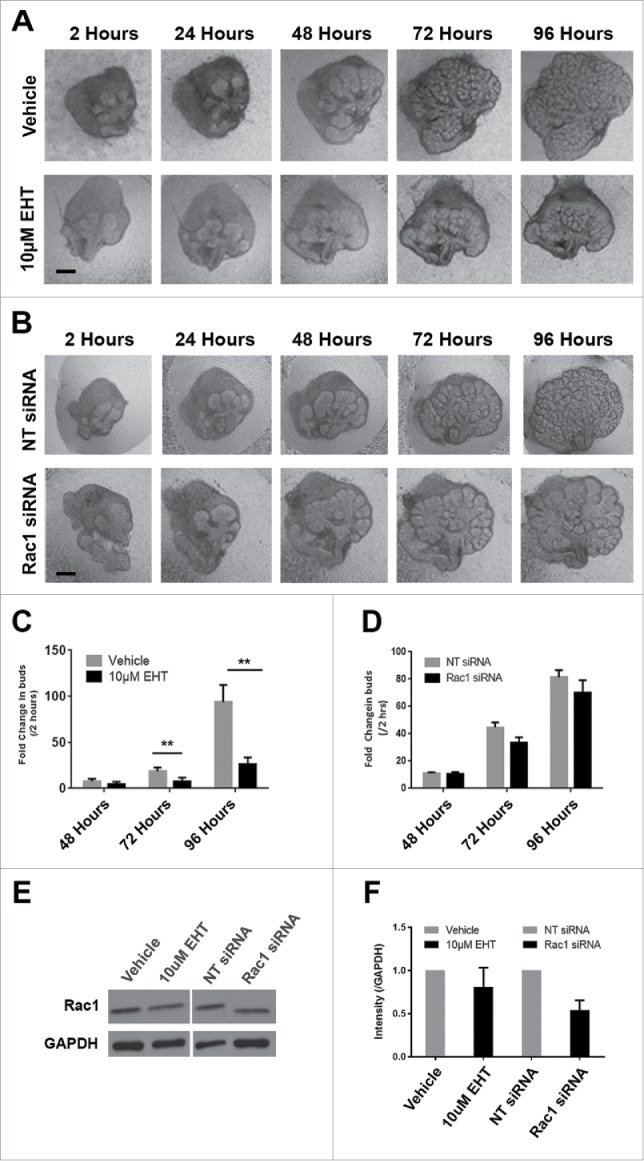
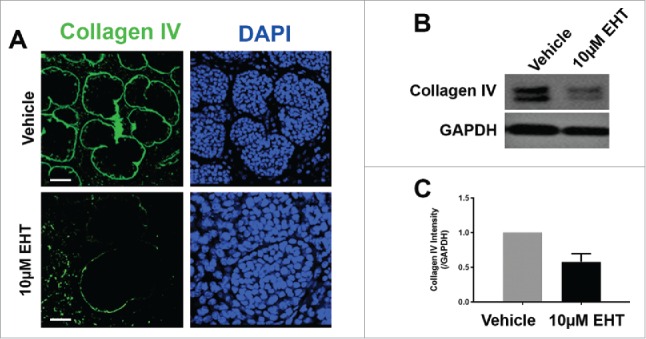
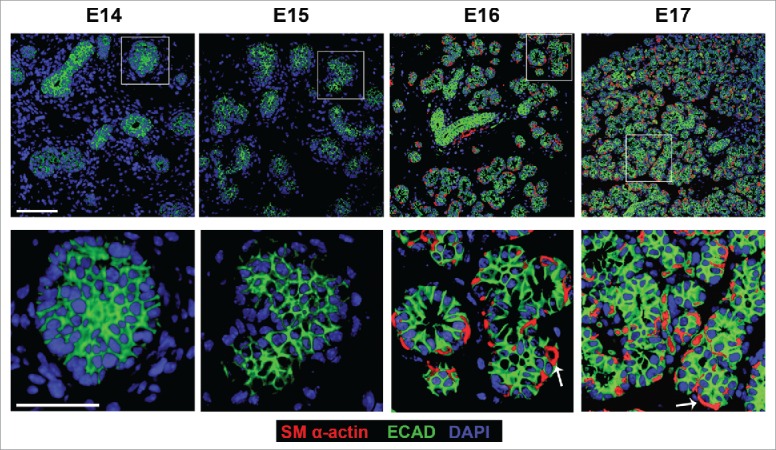
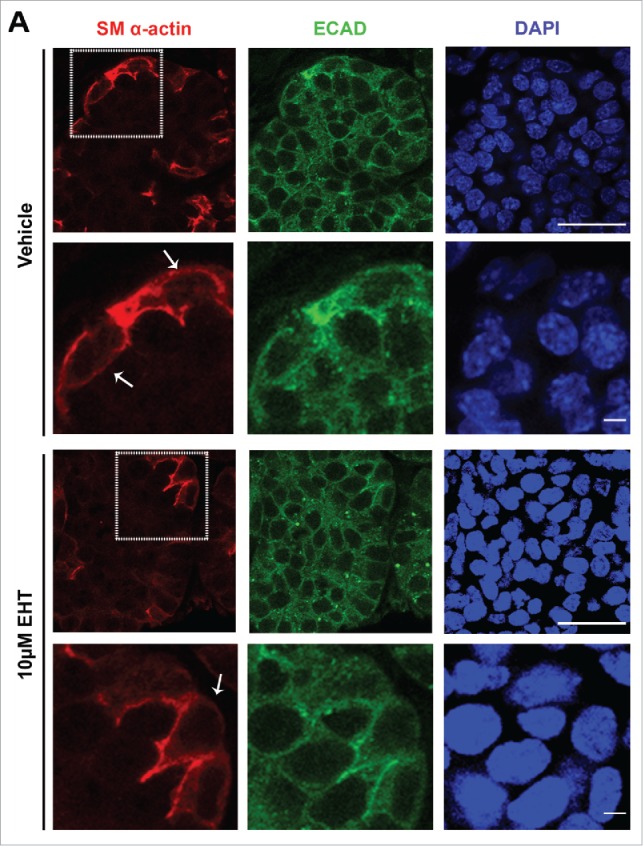
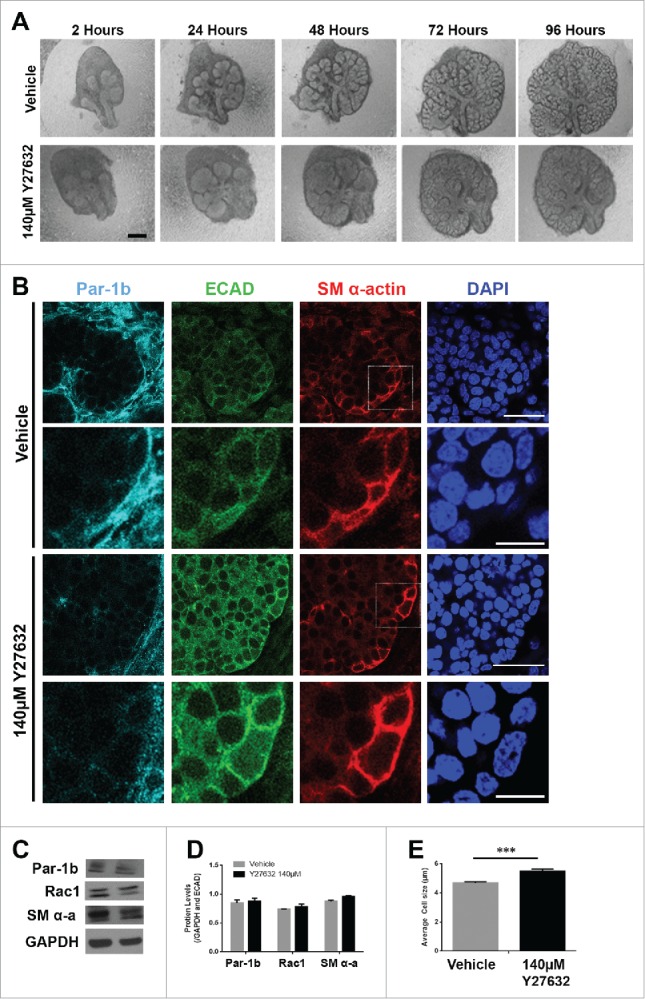
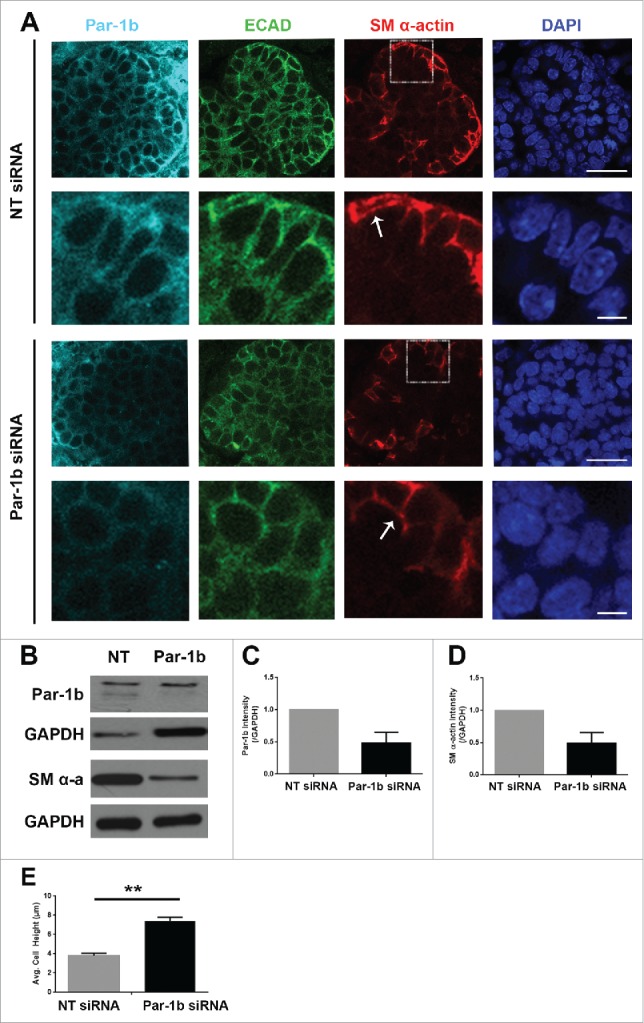
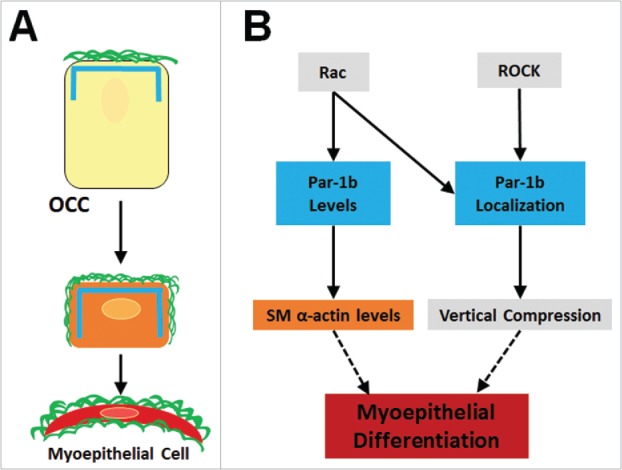
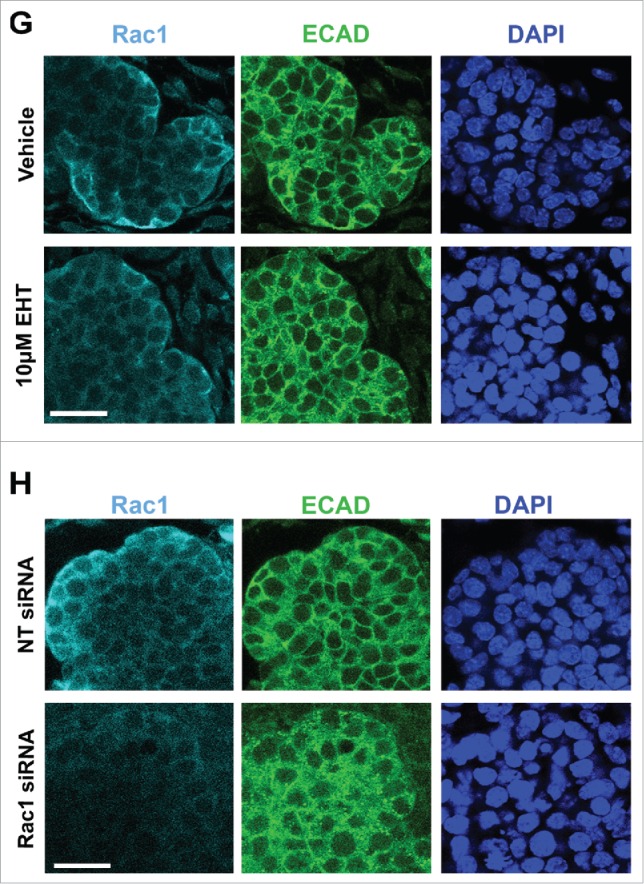
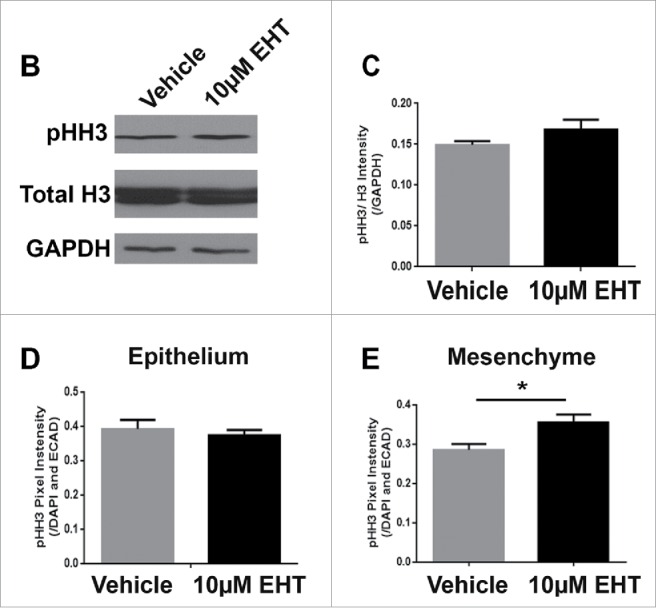
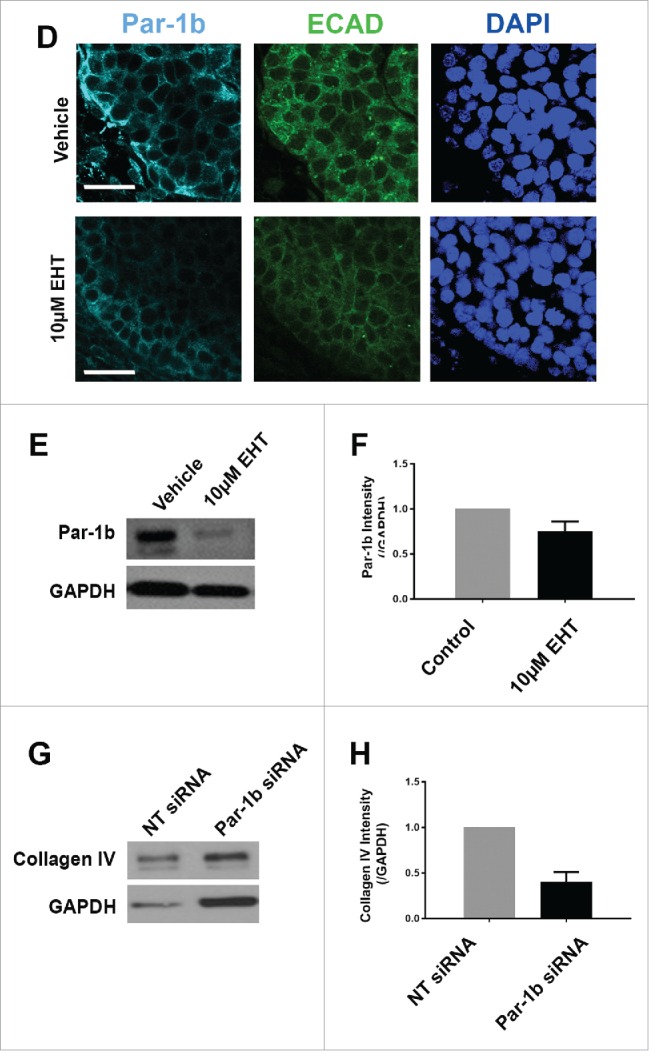
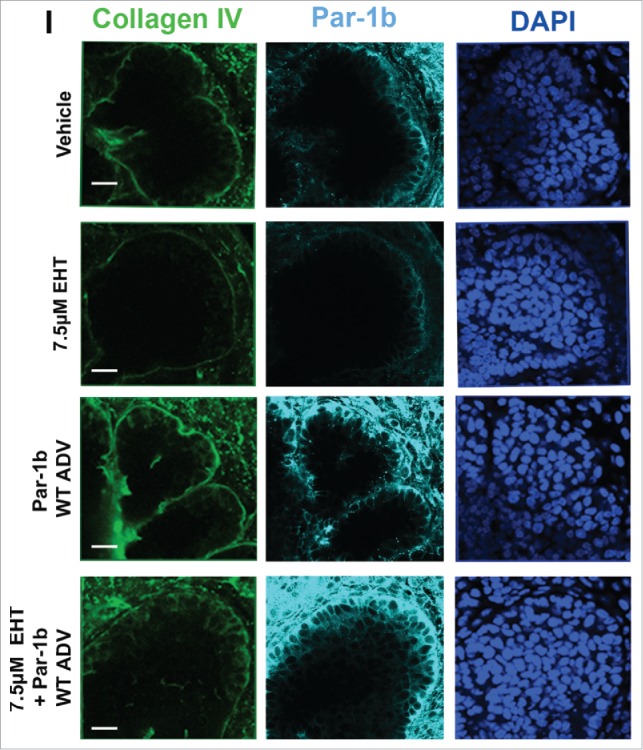
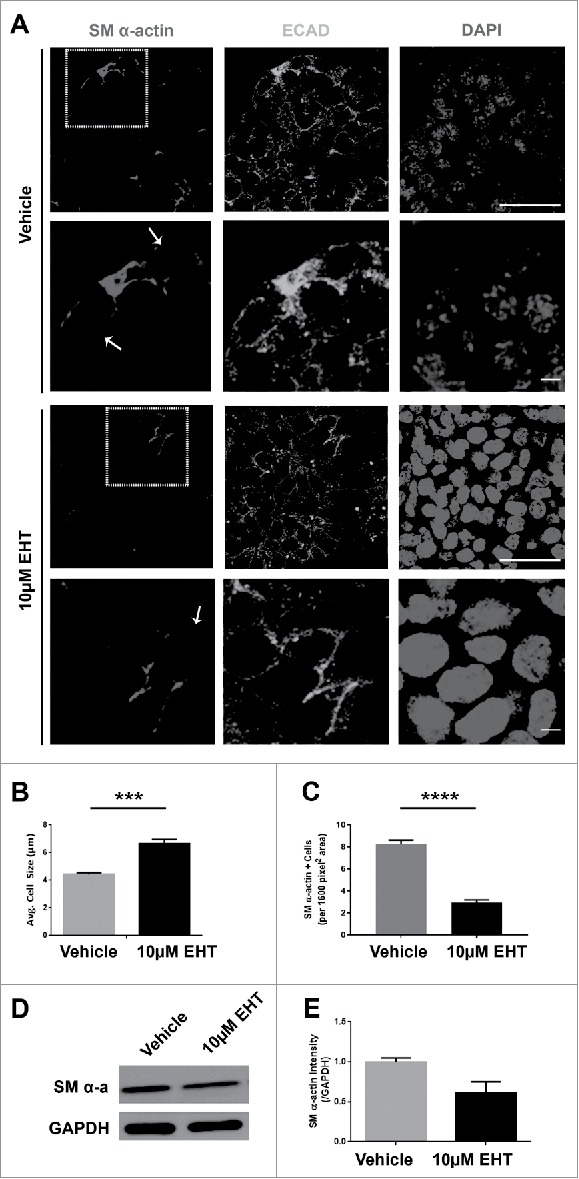
The salivary epithelium initiates as a solid mass of epithelial cells that are organized into a primary bud that undergoes morphogenesis and differentiation to yield bilayered acini consisting of interior secretory acinar cells that are surrounded by contractile myoepithelial cells in mature salivary glands. How the primary bud transitions into acini has not been previously documented. We document here that the outer epithelial cells subsequently undergo a vertical compression as they express smooth muscle α-actin and differentiate into myoepithelial cells. The outermost layer of polarized epithelial cells assemble and organize the basal deposition of basement membrane, which requires basal positioning of the polarity protein, Par-1b. Whether Par-1b is required for the vertical compression and differentiation of the myoepithelial cells is unknown. Following manipulation of Par-1b in salivary gland organ explants, Par-1b-inhibited explants showed both a reduced vertical compression of differentiating myoepithelial cells and reduced levels of smooth muscle α-actin. Rac1 knockdown and inhibition of Rac GTPase function also inhibited branching morphogenesis. Since Rac regulates cellular morphology, we investigated a contribution for Rac in myoepithelial cell differentiation. Inhibition of Rac GTPase activity showed a similar reduction in vertical compression and smooth muscle α-actin levels while decreasing the levels of Par-1b protein and altering its basal localization in the outer cells. Inhibition of ROCK, which is required for basal positioning of Par-1b, resulted in mislocalization of Par-1b and loss of vertical cellular compression, but did not significantly alter levels of smooth muscle α-actin in these cells. Overexpression of Par-1b in the presence of Rac inhibition restored basement membrane protein levels and localization. Our results indicate that the basal localization of Par-1b in the outer epithelial cells is required for myoepithelial cell compression, and Par-1b is required for myoepithelial differentiation, regardless of its localization.

Keywords: Par-1b; ROCK; Rac1; apicobasal polarity; branching morphogenesis; differentiation; myoepithelial cells; submandibular gland.


Figures

FIGURE 1.
FIGURE 1.
Decreased Branching Morphogenesis of the Mouse Submandibular Salivary Gland with Pharmacological Inactivation of Rac GTPase activity or siRNA Knockdown of Rac1. Representative brightfield images of E13 SMG organ explants cultured for 96 hours (A) with vehicle control or 10 µM EHT, (B) non-targeting (NT) siRNA or Rac-1 siRNA indicate Rac1 expression and activity are both required for proper branching morphogenesis of the developing SMG. Scale bars, 100 µm. (C) Morphometric analysis of control and 10 µM EHT-treated E13 SMGs show a statistically significant decrease in the number of buds in EHT-treated glands (**p ≤ 0 .01) and (D) morphometric analysis of Rac1 siRNA-treated glands show a decreasing trend in bud number relative to NT siRNA-treated glands. (E) Representative western blots and (F) quantification of Rac1 levels in glands treated with 10 µM EHT or Rac1 siRNA, normalized to GAPDH, and compared to controls shows a decrease after siRNA treatment (46% reduction) but not with EHT treatment, as expected (n ≥ 3 experiments) (n.s.). (G and H) Immunocytochemistry (ICC) for Rac1 (cyan) and ECAD (green), with DAPI (blue) staining for nuclei shows Rac1 localized primarily in the outer epithelial cells with no change in localization following 10 µM EHT treatment for 96 hours but a decrease in Rac1 levels within the ECAD+ epithelium after Rac1 siRNA treatment. Scale bars, 10 µm.
FIGURE 2.
FIGURE 2.
Epithelial Proliferation is Not Affected by the Inhibition of Rac GTPase. (A) ICC to detect histone H3 phosphorylated on Serine 10 (pHH3, white) and DAPI to stain nuclei (blue) following treatment with vehicle or 10 µM EHT for 48 hours shows no major change in pHH3 staining or localization of positive cells within the epithelium. Boxed area in the top panel shows the zoom in area for the bottom panel for each condition. All scale bars, 100 µm. (B and C) A representative protein gel blot and quantification (n ≥ 3) indicate no significant change in pHH3 with EHT-mediated inactivation of Rac1 when compared to total histone H3 levels and GAPDH. (D and E) Pixel intensity quantifications performed on 63X confocal images of E13 glands treated with vehicle or 10 µM EHT for 48 hours and subjected to ICC indicate no notable change in pHH3 levels in the epithelium but an increase in pHH3 in the mesenchymal compartment (p ≤0.05) when quantified separately (n ≥10 images per condition).
FIGURE 3.
FIGURE 3.
Rac GTPase Inactivation Results in Disruption of the Basement Membrane and Cellular Polarity. (A) ICC for collagen IV (green) and DAPI staining (blue) following 96-hour culture of E13 SMGs treated with vehicle or 10 µM EHT indicate Rac1 inactivation reduces collagen IV in the basement membrane surrounding epithelial buds. Scale bars, 10 µm. (B and C) Representative western analysis and quantification performed following 96-hour culture with or without 10 µM EHT demonstrates a slight loss in collagen IV levels (42% reduction) in E13 SMG with EHT treatment (p = 0.66, n ≥ 3 Experiments). (D) ICC following 96-hour culture with or without 10 µM EHT for Par-1b (cyan) and collagen IV (green) with DAPI staining (blue) demonstrates a loss in Par-1b levels in the outer epithelial cells with EHT treatment. Scale bars, 20 µm. (E and F). Western analysis for Par-1b following EHT treatment indicates a loss of total Par-1b within the gland (25% reduction), quantified relative to GAPDH (n ≥ 3). (G) SMGs were treated with either Par-1b or NT control siRNA, and Western analysis was performed to detect collagen IV and GAPDH. (H) Quantification of collagen IV levels demonstrated 60% reduction in Par-1b levels relative to GAPDH (n = 3). (I) E13 epithelial rudiments treated with vehicle or Par-1b WT adenovirus were recombined with untreated mesenchyme, and cultured for 96 hours either with or without 7.5 µM EHT. ICC was performed for collagen IV (green) and Par-1b (cyan), together with DAPI staining for nuclei (blue). Par-1b WT adenovirus treatment shows increased collagen IV levels relative to control, and glands treated with both WT Par-1b adenovirus and EHT show an intermediate phenotype indicating partial rescue of collagen IV with exogenous Par-1b in the presence of EHT. Scale bars, 10 µm.
FIGURE 4.
FIGURE 4.
In Vivo Morphogenesis and Differentiation of the Myoepithelium in the Developing SMG. E14, E15, E16 and E17 SMGs were removed from embryos, immediately fixed, and subjected to ICC for SM α-actin (red), ECAD (green), and staining for DAPI (blue). The immature OCC epithelial cells do not express detectable SM α-actin until the E16 stage, coincident with the vertically compression that occurs as they differentiate into myoepithelial cells. Scale Bar, 100 µm top panel and 50 µm in bottom panel.
FIGURE 5.
FIGURE 5.
Rac GTPase Inhibition Disrupts the Morphogenesis and Differentiation of the Myoepithelium in the Developing SMG. (A) ICC for SM α-actin (red) and ECAD (green) with DAPI staining (blue) performed on E13 SMGs treated with 10µM EHT for 96 hours shows that the SM α-actin+ cells undergo a vertical compression after 96 hrs culture relative to the glands that were treated with EHT. Scale bar, 10µm (rows 1 and 3) and 2µm (rows 2 and 4). (B) The cell height (µm) of individual ECAD+/SM α-actin+ epithelial cells was quantified in glands treated with or without 10µM EHT for 96 hours. The height of these cells in the EHT-treated glands was significantly greater than in the control glands (***p ≤ 0.001, n = 45). (C) The number of SM α-actin+ cells within an epithelial ROI (n ≥ 35) was significantly decreased following EHT treatment when compared to controls (****p < 0.0001). (D-E) Representative western analysis and quantification (n ≤ 3) performed on whole E13 glands following 96-hour culture +/− EHT treatment indicated a decrease of approximately 40% in SM α-actin levels in EHT-treated relative to control glands.
FIGURE 6.
FIGURE 6.
ROCK is Required for the Morphogenesis but Not the Differentiation of the Myoepithelial Cells in the Developing Mouse SMG (A) Representative brightfield images of E13 SMG explants cultured for 96 hours with vehicle control media or with 140µM Y27632 to inactivate ROCK. Scale bar, 100µm. (B) ICC was performed on E13 explants grown in culture for 96 hours and treated with vehicle or with 140µM Y27632 ECAD (green), Par-1b (cyan), and SM α-actin (red) with DAPI staining (blue). Y27632-treated glands show a mislocalization of Par-1b throughout the cytoplasm of ECAD+ cells rather than a basolateral restriction in these cells. Additionally, SM α-actin+ cells appeared to be less compressed with Y27632 treatment. Scale bars, 10µm top panels, 2µm bottom panels. Lower panels are zooms from boxed areas in top panels (C and D) Representative western analysis and quantification (n ≥ 3) following 96-hour culture +/− 140µM Y27632 treatment shows no significant change in the levels of Par-1b, Rac1, or SM α-actin. (E) The height (µm) of individual epithelial cells expressing SM α-actin (n ≥100 ) was measured in glands treated +/− 140µM Y27632 for 96 hours. Height of the ECAD+/SM α-actin+ cells in the glands treated with Y27632 was significantly larger than in the vehicle control-treated glands (*** p ≤ 0.001)
FIGURE 7.
FIGURE 7.
Par-1b is Required for the Morphogenesis and Differentiation of Myoepithelial Cells in the Developing Mouse SMG. (A) ICC was performed on E13 glands grown in culture for 96 hours that were treated with either NT siRNA or Par-1b siRNA (500nM) to detect Par-1b (cyan), ECAD (green), and SM α-actin (red), with DAPI staining (blue). The lower panel of images are zooms from boxed area in the top panel. A significant decrease in the number of SM α−actin-positive cells was observed following Par-1b siRNA treatment as well as an increase in ECAD+/SM α−actin+ cell height. Scale bars, 10µm top panels, 2µm bottom panels. (B) Western analysis was performed on whole glands following 96-hour culture with Par-1b or NT siRNA to detect the same proteins relative to GAPDH. Representative Westerns are shown. n ≥ 3 experiments for each blot. (C) Par-1b siRNA-induced knockdown was confirmed. (D) Par-1b siRNA treatment led to a reduction in the levels of SM α-actin relative to NT siRNA. (E) The height (µm) of individual epithelial cells expressing SM α-actin were measured in glands treated with NT siRNA or Par-1b siRNA for 96 hours. The height of the ECAD+/SM α-actin+ Par-1b siRNA-treated cells was significantly greater than that of ECAD+/SM α-actin+ NT siRNA-treated cells (n ≥ 25 cells/condition). (** p ≤ 0.01).
FIGURE 8.
FIGURE 8.
Summary of Myoepithelial Cell Differentiation and Morphogenesis. (A) Outer cuboidal cells (OCCS) in E13 SMGs localize Par-1b (blue lines) to the basal periphery, adjacent to the assembled basement membrane (green lines). Following 96-hour culture, untreated OCCs undergo vertical compression and begin to express the myoepithelial cell marker, SM α-actin (orange rectangle), and localization of Par-1b and basement membrane is extended laterally in as the cells undergo vertical compression and myoepithelial differentiation. (B) Working model for molecular control of myoepithelial cell differentiation. Par-1b localization is controlled directly or indirectly downstream of both Rac and ROCK. Localized Par-1b regulates vertical compression in differentiating myoepithelial cells. Par-1b protein levels are controlled directly or indirectly by Rac and maintain levels of SM α-actin, a myoepithelial marker.
None
None
None
None
None

Similar articles

Cited by

References

    1. Patel VN, Rebustini IT, Hoffman MP. Salivary gland branching morphogenesis. Differentiation 2006; 74:349-64; PMID:16916374; http://dx.doi.org/10.1111/j.1432-0436.2006.00088.x - DOI - PubMed
    1. Tucker AS. Salivary gland development. Semin Cell Dev Biol 2007; 18:237-44; PMID:17336109; http://dx.doi.org/10.1016/j.semcdb.2007.01.006 - DOI - PubMed
    1. Grobstein C. Morphogenetic interaction between embryonic mouse tissues separated by a membrane filter. Nature 1953; 172(4384):869-70; PMID:1311121916613830 - PubMed
    1. Cardoso WV, Lü J. Regulation of early lung morphogenesis: questions, facts and controversies. Development 2006; 133:1611-24; PMID:16613830 - PubMed
    1. Sakai T. Epithelial branching morphogenesis of salivary gland:exploration of new functional regulators. J Med Investig 2009; 56:234-8; http://dx.doi.org/10.2152/jmi.56.234 - DOI - PubMed

LinkOut - more resources