. 2017 Jan 12;541(7636):242-246.
doi: 10.1038/nature20599. Epub 2016 Nov 14.

Structures of riboswitch RNA reaction states by mix-and-inject XFEL serial crystallography

Affiliations

Structures of riboswitch RNA reaction states by mix-and-inject XFEL serial crystallography

J R Stagno et al. Nature. .

Abstract

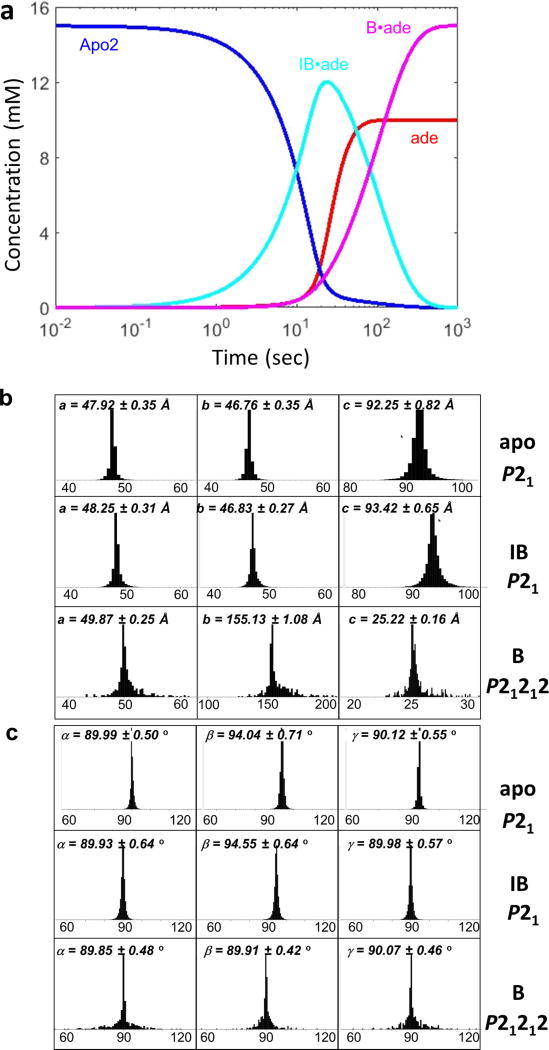
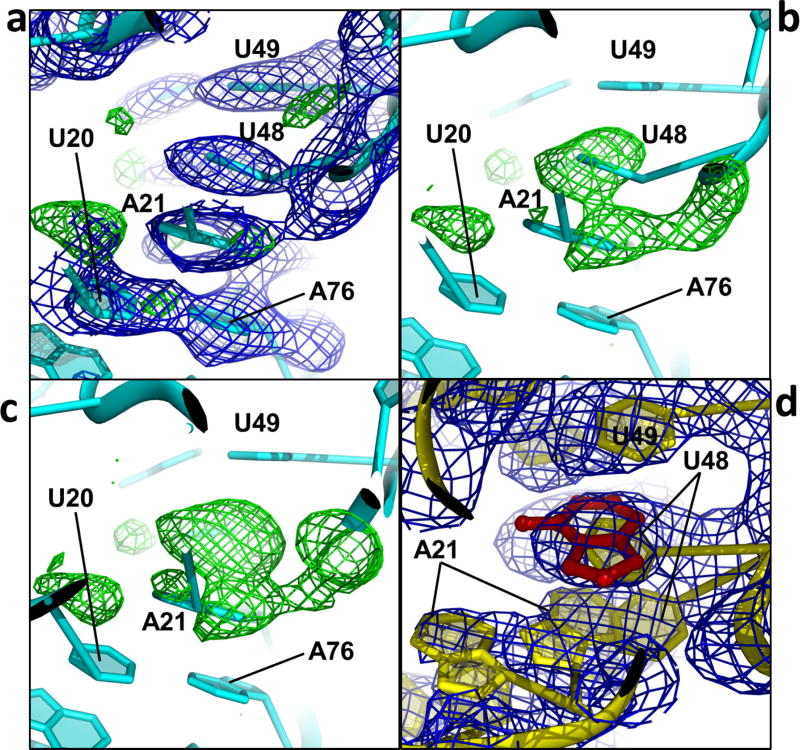
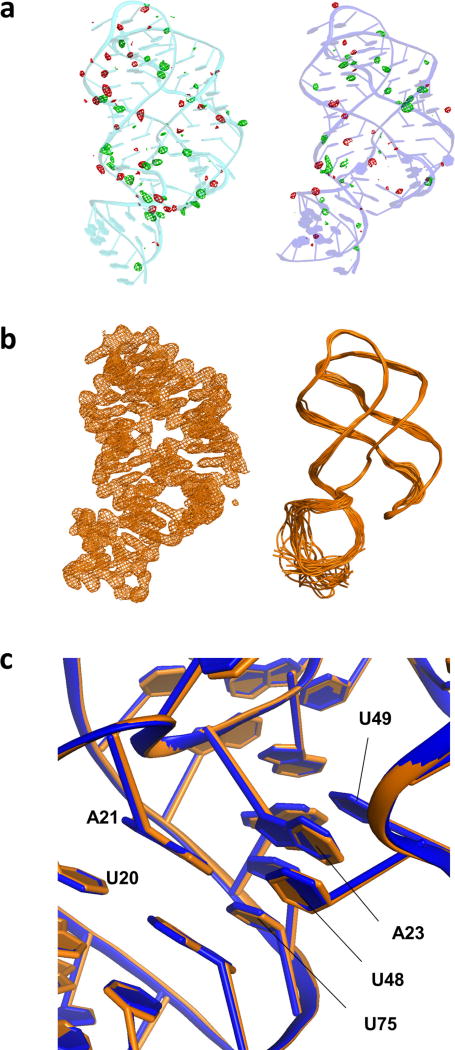
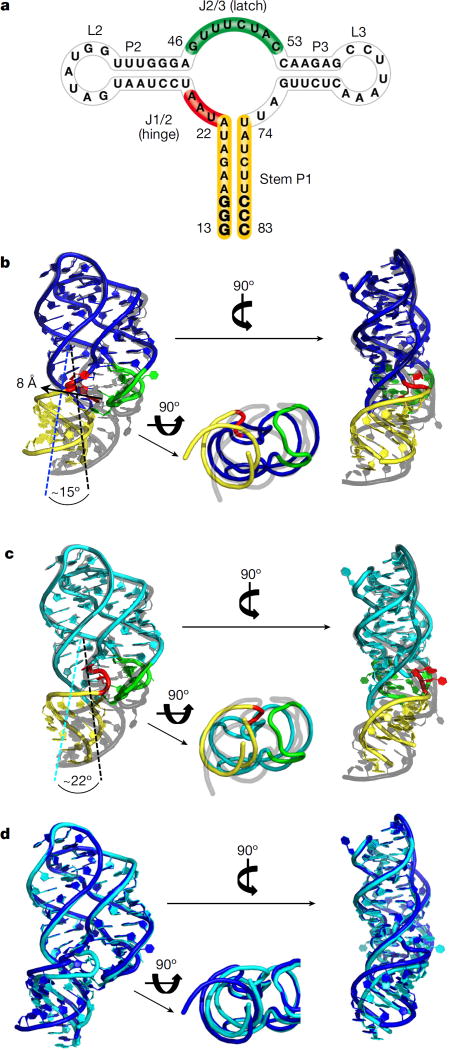
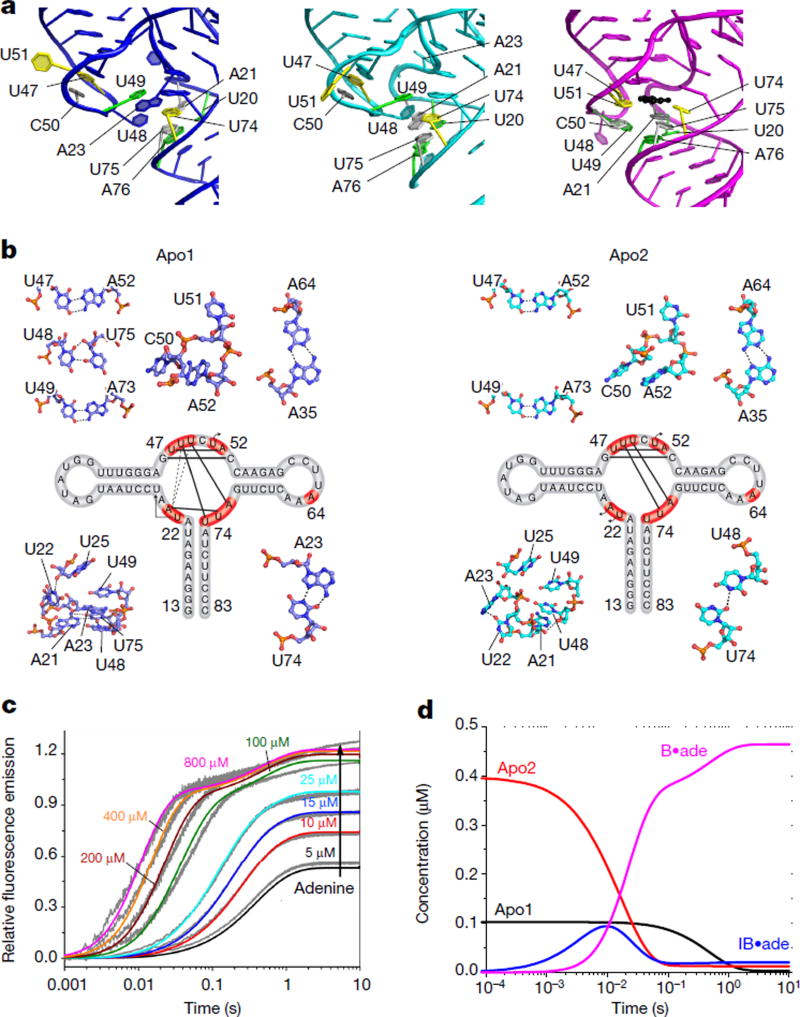
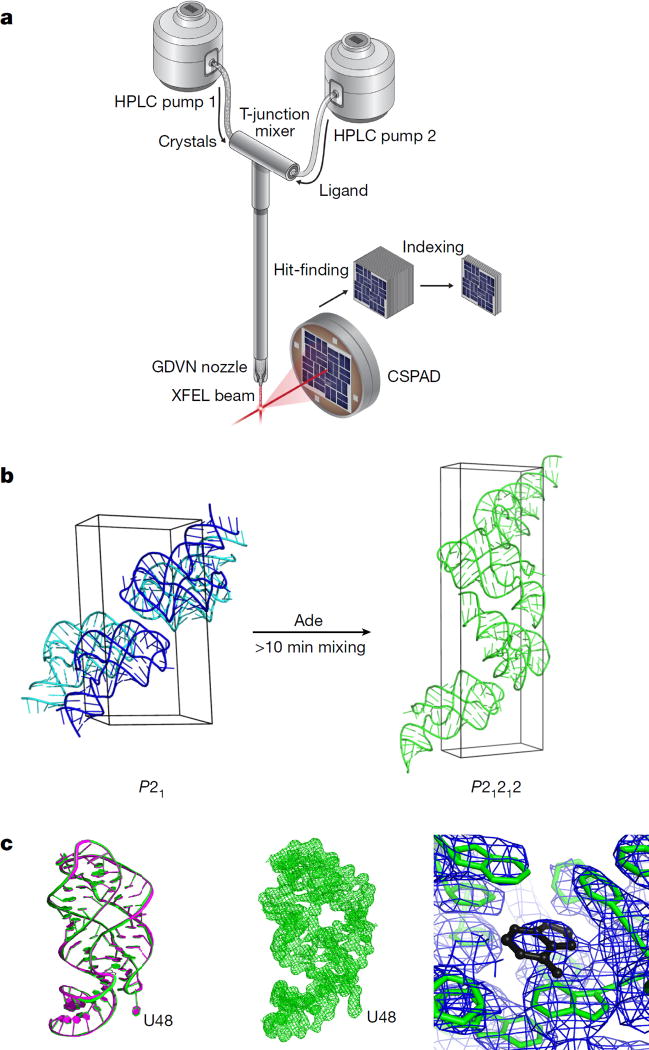
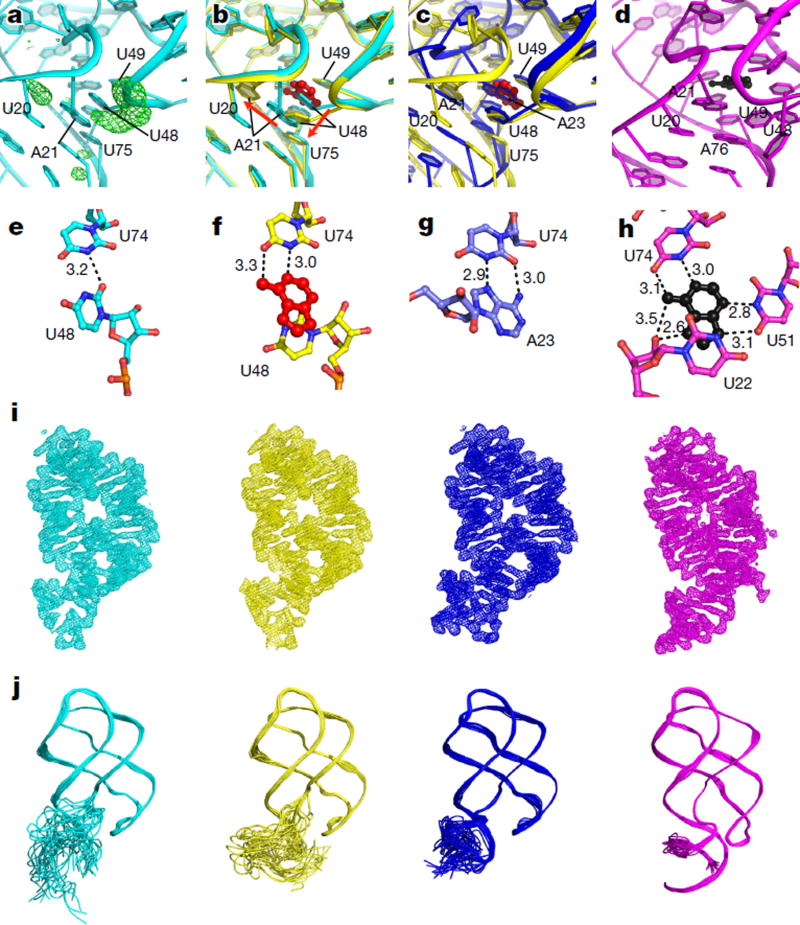
Riboswitches are structural RNA elements that are generally located in the 5' untranslated region of messenger RNA. During regulation of gene expression, ligand binding to the aptamer domain of a riboswitch triggers a signal to the downstream expression platform. A complete understanding of the structural basis of this mechanism requires the ability to study structural changes over time. Here we use femtosecond X-ray free electron laser (XFEL) pulses to obtain structural measurements from crystals so small that diffusion of a ligand can be timed to initiate a reaction before diffraction. We demonstrate this approach by determining four structures of the adenine riboswitch aptamer domain during the course of a reaction, involving two unbound apo structures, one ligand-bound intermediate, and the final ligand-bound conformation. These structures support a reaction mechanism model with at least four states and illustrate the structural basis of signal transmission. The three-way junction and the P1 switch helix of the two apo conformers are notably different from those in the ligand-bound conformation. Our time-resolved crystallographic measurements with a 10-second delay captured the structure of an intermediate with changes in the binding pocket that accommodate the ligand. With at least a 10-minute delay, the RNA molecules were fully converted to the ligand-bound state, in which the substantial conformational changes resulted in conversion of the space group. Such notable changes in crystallo highlight the important opportunities that micro- and nanocrystals may offer in these and similar time-resolved diffraction studies. Together, these results demonstrate the potential of 'mix-and-inject' time-resolved serial crystallography to study biochemically important interactions between biomacromolecules and ligands, including those that involve large conformational changes.


Conflict of interest statement

The authors declare no competing financial interests.

Figures

Extended Data Figure 1
Extended Data Figure 1. Characterization of RNA crystals
Microcrystals of apo-rA71 were grown using batch crystallization as described in Methods. A SONICC Imager (Formulatrix) was used to image each sample (0.5–1.0 µl) of crystals using three different methods: visible light (a); UV-TPEF (b); and second-order nonlinear imaging of chiral crystals (SONICC) (c). d, Crystal samples were observed using a stereomicroscope (Zeiss) under cross-polarized light. e, Without cross-polarization, crystals were barely observable. f, The relative quality of the crystalline samples was measured by powder X-ray diffraction (APS beamline 19-ID), with a maximum observable resolution of approximately 6 Å. The resolution ring (red) corresponds to 6.8 Å.
Extended Data Figure 2
Extended Data Figure 2. Characterization of rA71 in solution by small angle X-ray scattering
a, Comparison of the Kratky plots of the solution X-ray scattering curves of rA71 in the apo (black) and bound (red) states. b, Plot of back-calculated small angle X-ray scattering (SAXS) profiles of apo1 and apo2 conformers along with solution X-ray scattering curves of rA71 in the apo (red) states. c, Experimental SAXS curve shown in red with red error bars and superimposed with the SAXS curves that were back-calculated from 128 structures using the two-member ensemble calculation. The ratio of the two conformers (apo2:apo1) is approximately 0.9:0.1 to give the best fit to the experiment data with χ2 values ranging approximately from 0.1 to 0.3.
Extended Data Figure 3
Extended Data Figure 3. Three-way junction undergoes notable structural rearrangements to accommodate ligand, compressing the major groove
a, The three-way junction, depicted in three orientations, as observed in the apo1 (blue), apo2 (cyan,), and ligand-bound (magenta, PDB code 4TZX) structures. Virtually all residues in the three-way junction undergo considerable conformational changes upon ligand binding. Most notable are the ‘swinging’ residues in the hinge (U22, A23) and latch (U48, U49, U51) regions, the atomic positions of which differ by as much as 17 Å in the apo conformers relative to the ligand-bound conformer. b, In the absence of ligand, concerted movement of the hinge (depicted as white surface and stick model) and latch regions results in considerable narrowing of the major groove formed between helices P1 and P3, which measures 9.4 Å, 10.0 Å and 16.6 Å for apo1, apo2 and ligand-bound conformers, respectively. Major groove distances were measured between the phosphorous atoms of U71 and A19 (or U20 in the case of apo1 owing to a difference in register).
Extended Data Figure 4
Extended Data Figure 4. Multistage ligand binding kinetics to the rA71 riboswitch
Ligand binding to the rA71 riboswitch was monitored by replacing U48 with the fluorescent base analogue 2-aminopurine (2AP; termed rA71-U482AP). The 2AP fluorescence emission intensity increases upon ligand-induced reorganization of the binding pocket. The 2AP substitution does not change the secondary structure of the apo rA71 riboswitch, as judged by partial RNase digestion. a, Equilibrium titration of rA71-U482AP with adenine yields Kd = 5 µM (black symbols). A similar Kd value was obtained from the endpoints of the kinetics progress curves (red symbols) and from in-line probing experiments. This value is about tenfold higher than adenine binding to the unmodified riboswitch, possibly because 2AP forms more stable base-stacking interactions in the apo structure. Error bars show the standard deviation from the average of two or more independent trials. b, The ligand-binding kinetics is consistent with a four-state mechanism. Binding of 0.5–1,600 µM adenine to 0.5 µM rA71-U482AP was measured by stopped-flow fluorescence (1.8 ms deadtime), as described in the Methods. The apparent rate constants for adenine association, λfast and λslow, were obtained from fits of individual trajectories to a biphasic rate equation, ΔF = Afast(1 − exp(−λfastt)) + Aslow(1 − exp(−λslowt)), where A denotes for adenine concentrations. Error bars as in a. The nonlinear increase in λfast (filled symbols) with adenine concentration over the full range of ligand concentrations indicates the presence of one or intermediates in the binding mechanism. The ligand-independent phase, λslow (open symbols), results in biphasic trajectories above 50 µM adenine and is explained by slow exchange between binding competent and binding incompetent forms of the riboswitch. c, The apparent bimolecular rate constant for adenine association is slower than diffusion and was obtained from λfast versus [adenine], under pseudo-first order conditions (0.5–25 µM adenine) in which ligand binding to the competent (open) riboswitch is rate-limiting. In 10 mM MgCl2 (filled symbols), kon = 1.9 × 10⁵ M−1 s−1 and koff = 1.7 s−1. In 1.25 mM MgCl2 (open symbols), kon = 5.2 × 10⁴ M−1 s−1 and koff = 2.1 s−1. The error bars are as in a with n = 3 over three independent trials. d, e, The same set of reduced experimental data in Fig. 2c was globally fit to simpler three-state kinetic mechanisms as described in the Supplementary Discussion. These models were not able to describe the solution binding kinetics over the full-range of ligand concentrations tested. Therefore, the four-state model in equation (1) is the simplest mechanism capable of describing the data. We do not exclude the possibility that the riboswitch samples additional apo states and intermediate complexes that may contribute to the robustness of the switch mechanism. d, Three-state mechanism with only one apo state. The parameters obtained from the fitting are: kon = 0.28 µM−1 s−1, koff = 37 s−1, kf = 103 s−1, kr = 5.1 s−1, sc = 2.03. Err(k, sc) = 0.053, where sc is scaling value and rate constants (k) by minimizing a Chi-squared error function Err(k, sc) that describes the discrepancy between calculated curves and experimental data sets (Supplementary Discussion). e, Three-state mechanism with two apo states and no binding intermediate. Parameters: kop = 2.5 s−1, kcl = 0.58 s−1, kon = 0.16 µM−1 s−1, koff = 0.79 s−1, sc = 2.44. Err(k,sc) = 0.056.
Extended Data Figure 5
Extended Data Figure 5. Time-course simulation of the IB concentration in the crystal and comparison of the unit cell dimensions of the apo, IB and bound structures
a, Simulated time courses of the IB buildup and changes in concentrations of ligand, apo2 and bound (B) states in the crystal. See also Methods. b, c, Space group and unit-cell dimensions of the crystals of apo, IB and bound states. The structure was converted in the crystal from the apo to the bound state after at least 10 min of mixing with adenine ligand. The crystal lattice remains unchanged after 10 s of mixing with ligand.
Extended Data Figure 6
Extended Data Figure 6. Determining the structure of the IB conformer
a, To first verify whether there were changes in the IB state relative to apo2, the apo2 structure was refined against the 10-s-mix data; 2 FoFc (1σ, blue) and FoFc (3σ, green) electron density maps are shown. Both maps indicated alternative positions for both U48 and A21. b, The occupancies of U48 and A21 of the apo2 state were set to 0.5 and refined in the same manner. The FoFc map (3σ, green) clearly indicated the alternative (IB) conformation of U48 with a blob of density in the original U48 position corresponding to the adenine ligand. The alternative conformation of A21 was much less pronounced and is partially disordered along with the adjacent hinge residues (U22 and A23). c, Keeping the occupancy of A21 at 0.5, the structure was refined with U48 omitted. The FoFc map (3σ, green) again supports the alternative configuration of U48, A21, and density for the adenine ligand. d, The final refined structure of the IB state with the adenine ligand (red), and alternative conformations for both U48 and A21 modelled at 0.5 occupancy, shown with 2 FoFc electron density map (1σ, blue).
Extended Data Figure 7
Extended Data Figure 7. FoFc and 2 FoFc electron density maps, and ensemble refinement model for the 10-s-mix data
a, Weighted FoFc difference electron density maps in green (3σ) and red (−3σ), computed using the apo structure (apo2, cyan; apo1, blue) and the structure factors from the 10-s-mix data. The isolated peaks, most likely corresponding to backbone phosphates, indicate a mixture of conformational states, and are predominantly in and around the three-way junction of the apo2 structure. b, 2 FoFc electron density map (1σ, left) and time-averaged molecular dynamics ensemble refinement model (right) for the ‘apo1-like’ molecule of the 10-s-mix structure. c, Superimposition of apo1 (blue) and the apo1-like molecule of the 10-s-mix structure (orange), indicating no structural changes to apo1 after 10 s of mixing with ligand.
Figure 1
Figure 1. Structure comparison of the ligand-bound and apo conformers
a, Secondary structure of rA71 with key regions highlighted in yellow (P1), red (hinge), and green (latch). The three consecutive GC pairs in P1 are illustrated in bold. bd, Cartoon representations in three different views, with key regions colour-coded as in a, comparing the structures of apo1 (blue) and ligand-bound (grey, PDB code 4TZX) (b); apo2 (cyan) and ligand-bound (grey) (c); and apo1 (blue) and apo2 (cyan) (d). The structures were aligned against the kissing-loops (L2 and L3), residues 29–41 and 58–68.
Figure 2
Figure 2. Structures of the three-way junction in the absence of ligand
a, The three-way junction, as observed in apo1 (blue), apo2 (cyan), and ligand-bound (magenta, PDB code 4TZX) structures, with base triples (yellow, grey and green) and adenine ligand (black) indicated. b, Secondary structures and detailed interactions (shown as ball-and-stick) of key residues (red) within the junctions of each of the apo conformers. In the secondary structure map, base pairs are depicted as solid black lines, and the movements of residues that flip outward are shown as black arrows. The stacking of A23 between U48 and U49 in apo1 is illustrated as dotted lines. c, Trajectories are shown for eight concentrations of adenine and are globally fit to the model in equation (1) (Supplementary Discussion). d, Evolution of species concentrations over time (Supplementary Discussion).
Figure 3
Figure 3. Setup of mix-and-inject SFX and conversion of the structure and crystal lattice
a, Cartoon of the SFX ligand-mixing experiment. For details, see Methods. b, The unit cells of the crystals of apo (P21) and ligand-bound (P21212), the structure of which was generated in crystallo from the apo structures after at least 10 min of mixing with the adenine ligand (Extended Data Fig. 5b, c). c, Superimposition (left) of the ligand-bound structures of the 10-min-mix (green) and PDB code 4TZX (magenta), and 2 FoFc electron density maps contoured at 1σ for the whole structure of the 10-min-mix (middle) and the binding pocket (right) showing the ligand (black).
Figure 4
Figure 4. Visualizing the ligand-bound intermediate state
a, FoFc map (3σ, green) of the binding pocket of apo2 (cyan), calculated after refining the apo-rA71 structure against the 10-s-mix data with adenine in the binding pocket and U48 removed, revealing altered conformations for U48 (large peak) and A21 (smaller peak). b, Superimposition of apo2 (cyan) and IB (yellow) states, showing the different conformations for U48 and A21. Adenine (red) binding to the apo2 state (cyan) results in displacement of U48, and consequently A21, to form the IB state (yellow). c, Superimposition of the apo1 (blue) and IB (yellow) structures, revealing very similar base-stacking interactions, in which A23 of apo1 (blue) takes the place of the IB ligand (red). d, Three-way junction with the adenine ligand (black) of the ligand-bound state (PDB code 4TZX) shown for comparison. eh, Ball-and-stick models, with hydrogen-bond interactions shown, of key residues in the ligand-binding pockets of apo2 (e), IB (f), apo1 (g) and ligand-bound (h) states. i, 2 FoFc electron density maps contoured at 1σ for apo2 (cyan), IB (yellow), apo1 (blue) and ligand-bound (magenta) states. j, Structure ensembles of apo2 (cyan), IB (yellow), apo1 (blue) and ligand-bound (magenta) structures from time-averaged molecular dynamics ensemble refinement, demonstrating the flexibility/stability of P1 in each of the four conformations.

References

    1. Mandal M, Boese B, Barrick JE, Winkler WC, Breaker RR. Riboswitches control fundamental biochemical pathways in Bacillus subtilis and other bacteria. Cell. 2003;113:577–586. - PubMed
    1. Nahvi A, et al. Genetic control by a metabolite binding mRNA. Chem. Biol. 2002;9:1043. - PubMed
    1. Breaker RR. Riboswitches and the RNA world. Cold Spring Harb. Perspect. Biol. 2012;4:a003566. - PMC - PubMed
    1. Hajdu J, et al. Analyzing protein functions in four dimensions. Nat. Struct. Biol. 2000;7:1006–1012. - PubMed
    1. Boutet S, et al. High-resolution protein structure determination by serial femtosecond crystallography. Science. 2012;337:362–364. - PMC - PubMed

Publication types