. 2017 Jan;49(1):54-64.
doi: 10.1038/ng.3715. Epub 2016 Nov 14.

Genome-wide association analyses using electronic health records identify new loci influencing blood pressure variation

Affiliations

Genome-wide association analyses using electronic health records identify new loci influencing blood pressure variation

Thomas J Hoffmann et al. Nat Genet. 2017 Jan.

Abstract

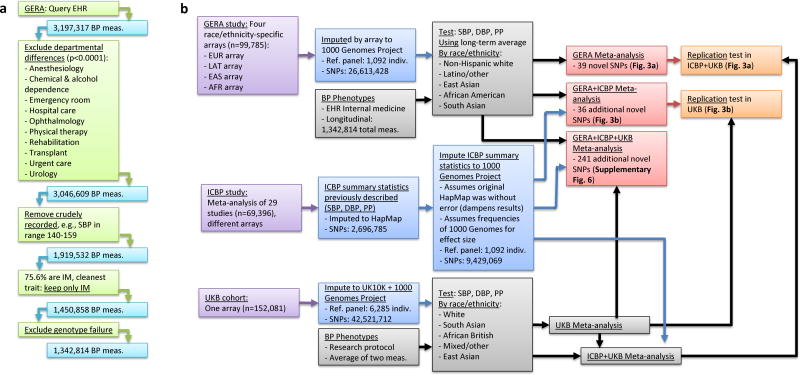
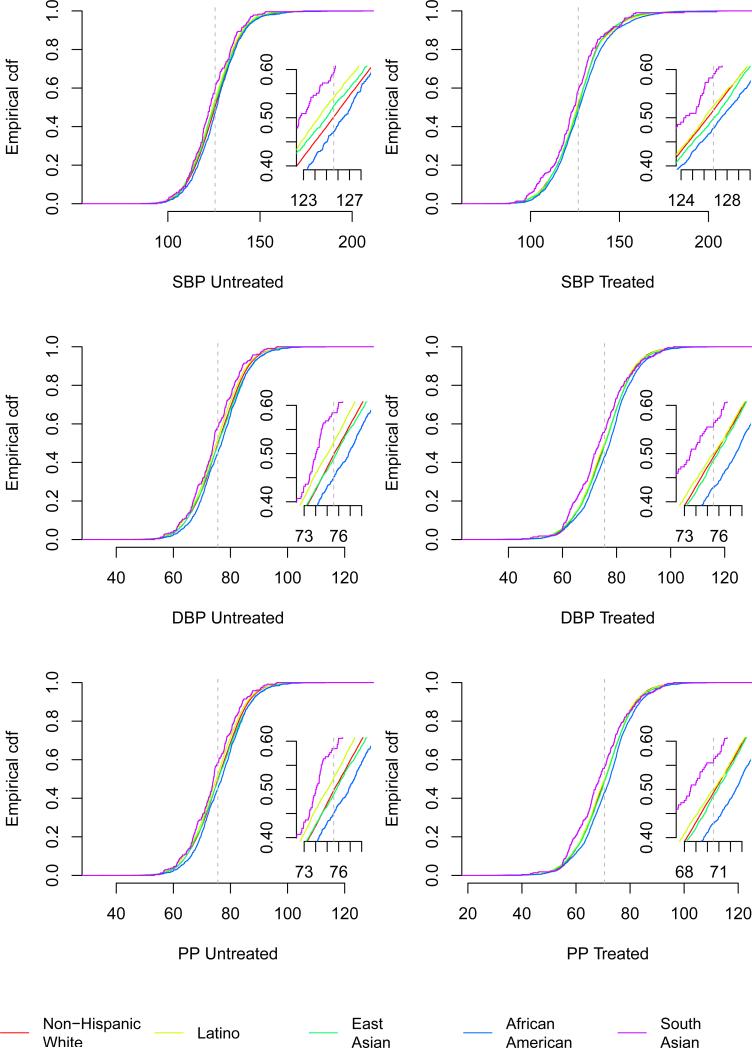
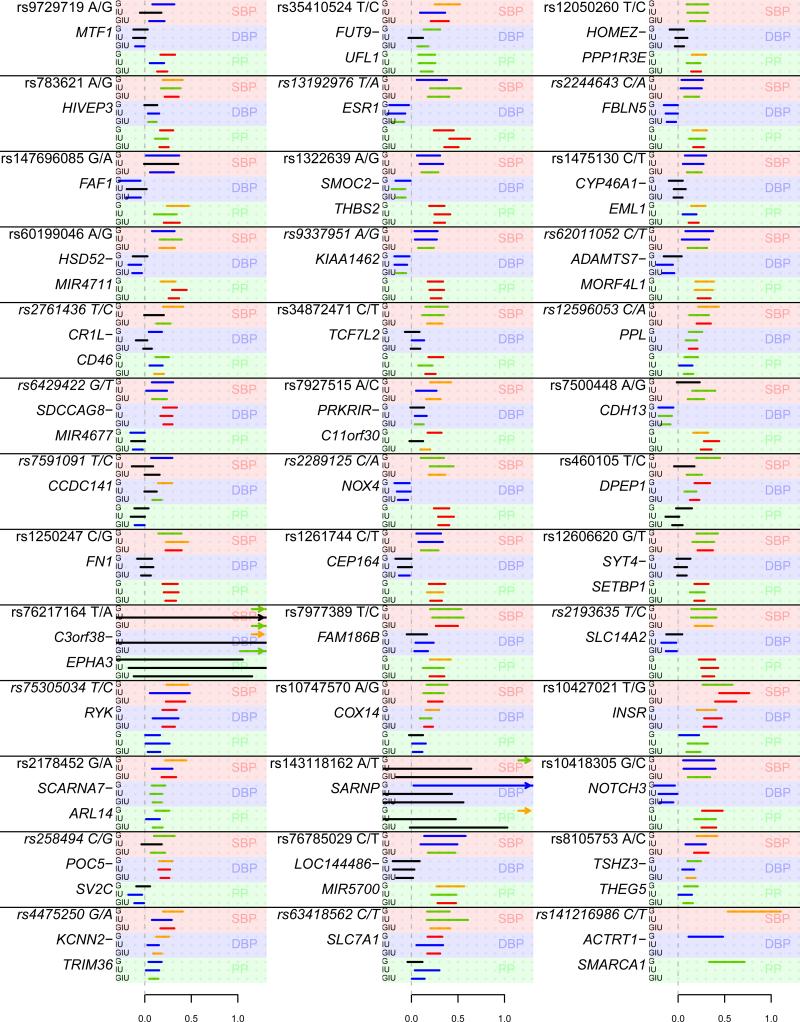
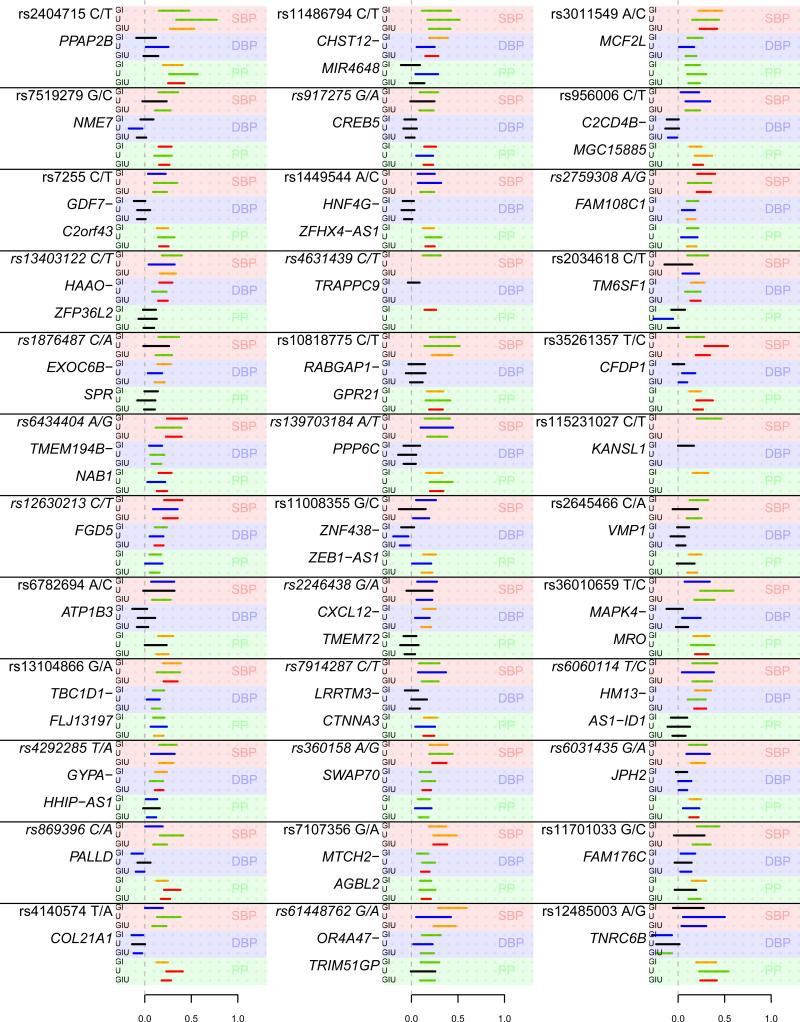
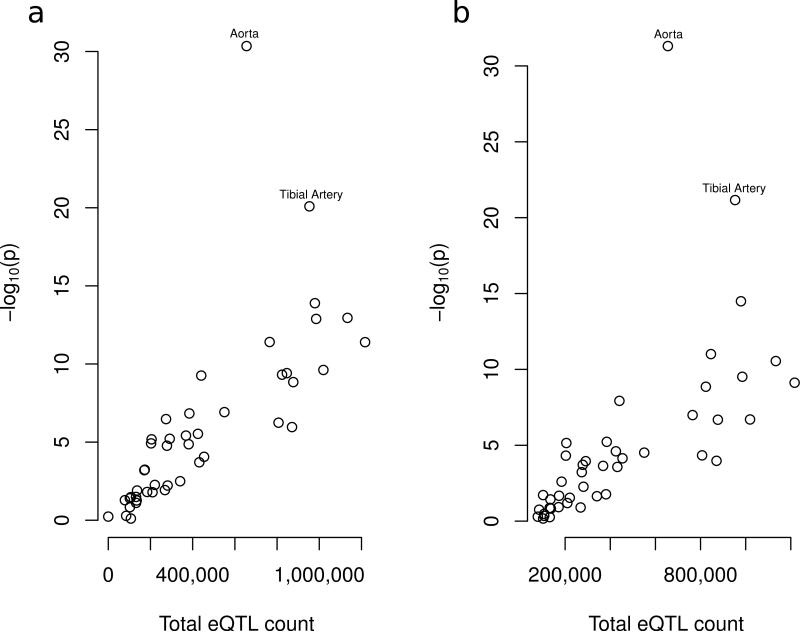
Longitudinal electronic health records on 99,785 Genetic Epidemiology Research on Adult Health and Aging (GERA) cohort individuals provided 1,342,814 systolic and diastolic blood pressure measurements for a genome-wide association study on long-term average systolic, diastolic, and pulse pressure. We identified 39 new loci among 75 genome-wide significant loci (P ≤ 5 × 10⁻⁸), with most replicating in the combined International Consortium for Blood Pressure (ICBP; n = 69,396) and UK Biobank (UKB; n = 152,081) studies. Combining GERA with ICBP yielded 36 additional new loci, with most replicating in UKB. Combining all three studies (n = 321,262) yielded 241 additional genome-wide significant loci, although no replication sample was available for these. All associated loci explained 2.9%, 2.5%, and 3.1% of variation in systolic, diastolic, and pulse pressure, respectively, in GERA non-Hispanic whites. Using multiple blood pressure measurements in GERA doubled the variance explained. A normalized risk score was associated with time to onset of hypertension (hazards ratio = 1.18, P = 8.2 × 10-45). Expression quantitative trait locus analysis of blood pressure loci showed enrichment in aorta and tibial artery.


Figures

Figure 1
Figure 1
Project workflow. (a) EHR phenotype extraction for the GERA cohort. (b) GWAS analysis approaches.
Figure 2
Figure 2
Empirical cumulative distribution functions of BP measures (mmHg), stratified by GERA race/ethnicity group and normalized to a 61 year old male with BMI 27kg/m2 for reference, indicated by the vertical dashed line. There were 80,792 non-Hispanic whites, 8,231 Latinos, 7,243 East Asians, 3,058 African Americans, and 461 South Asians.
Figure 3
Figure 3
Novel BP loci detected in GERA and tested for replication in the ICBP+UKB meta-analysis. The two SNPs rs76217164 and rs143118162 failed to impute in ICBP (owing to low allele frequency), and rs141216986 was on the X chromosome and not available in ICBP or UK. We used an additive model. The effect allele is the allele to the left (e.g., A in A/G). Effect sizes are indicated in mmHg. Each line represents the effect size and 95% confidence interval for each group, with the text on top of each line representing the group tested: G, GERA (n=99,785); IU, meta-analysis of the ICBP and UKB (n=221,477); and GIU, meta-analysis of GERA, ICBP, and the UKB (n=321,262). The color of each line indicates the statistical significance of the test: red, P≤10−9; orange, 10−9<P≤5×10⁻⁸; green, 5×10⁻⁸<P≤0.00067 (Bonferroni correction for 39+36=75 SNPs); blue, 0.00066<P≤0.05; black, P>0.05.
Figure 4
Figure 4
Novel BP loci identified in the GERA+ICBP meta-analysis, and tested for replication in the UKB. We used an additive model. The effect allele is the allele to the left (e.g., A in A/G). Effect sizes are indicated in mmHg. Each line represents the effect size and 95% confidence interval for each group, with the text on top of each line representing the group tested: GI, meta-analysis of GERA and ICBP (n=169,181); U, UK Biobank (n=152,081); and GIU, meta-analysis of GERA, ICBP, and the UKB (n=321,262). The color of each line indicates the statistical significance of the test: red, P≤10−9; orange, 10−9<P≤5×10⁻⁸; green, 5×10⁻⁸<P≤0.00067 (Bonferroni correction for 39+36=75 SNPs); blue, 0.00066<P≤0.05; black, P>0.05.
Figure 5
Figure 5
Tissue specific expression quantitative trait loci (eQTL) analysis of 51 tissues. The two outlier tissues, accounting for total eQTL count, are labeled. Tissue total eQTL counts vs P-values at (a) the locus and (b) the sentinel variant.

Similar articles

  • Genome-wide association analysis identifies novel blood pressure loci and offers biological insights into cardiovascular risk.
    Warren HR, Evangelou E, Cabrera CP, Gao H, Ren M, Mifsud B, Ntalla I, Surendran P, Liu C, Cook JP, Kraja AT, Drenos F, Loh M, Verweij N, Marten J, Karaman I, Lepe MP, O'Reilly PF, Knight J, Snieder H, Kato N, He J, Tai ES, Said MA, Porteous D, Alver M, Poulter N, Farrall M, Gansevoort RT, Padmanabhan S, Mägi R, Stanton A, Connell J, Bakker SJ, Metspalu A, Shields DC, Thom S, Brown M, Sever P, Esko T, Hayward C, van der Harst P, Saleheen D, Chowdhury R, Chambers JC, Chasman DI, Chakravarti A, Newton-Cheh C, Lindgren CM, Levy D, Kooner JS, Keavney B, Tomaszewski M, Samani NJ, Howson JM, Tobin MD, Munroe PB, Ehret GB, Wain LV; International Consortium of Blood Pressure (ICBP) 1000G Analyses; BIOS Consortium; Lifelines Cohort Study; Understanding Society Scientific group; CHD Exome+ Consortium; ExomeBP Consortium; T2D-GENES Consortium; GoT2DGenes Consortium; Cohorts for Heart and Ageing Research in Genome Epidemiology (CHARGE) BP Exome Consortium; International Genomics of Blood Pressure (iGEN-BP) Consortium; UK Biobank CardioMetabolic Consortium BP working group. Warren HR, et al. Nat Genet. 2017 Mar;49(3):403-415. doi: 10.1038/ng.3768. Epub 2017 Jan 30. Nat Genet. 2017. PMID: 28135244 Free PMC article.
  • A multiethnic genome-wide association study of primary open-angle glaucoma identifies novel risk loci.
    Choquet H, Paylakhi S, Kneeland SC, Thai KK, Hoffmann TJ, Yin J, Kvale MN, Banda Y, Tolman NG, Williams PA, Schaefer C, Melles RB, Risch N, John SWM, Nair KS, Jorgenson E. Choquet H, et al. Nat Commun. 2018 Jun 11;9(1):2278. doi: 10.1038/s41467-018-04555-4. Nat Commun. 2018. PMID: 29891935 Free PMC article.
  • A Large Multiethnic Genome-Wide Association Study of Adult Body Mass Index Identifies Novel Loci.
    Hoffmann TJ, Choquet H, Yin J, Banda Y, Kvale MN, Glymour M, Schaefer C, Risch N, Jorgenson E. Hoffmann TJ, et al. Genetics. 2018 Oct;210(2):499-515. doi: 10.1534/genetics.118.301479. Epub 2018 Aug 14. Genetics. 2018. PMID: 30108127 Free PMC article.
  • Over 1000 genetic loci influencing blood pressure with multiple systems and tissues implicated.
    Cabrera CP, Ng FL, Nicholls HL, Gupta A, Barnes MR, Munroe PB, Caulfield MJ. Cabrera CP, et al. Hum Mol Genet. 2019 Nov 21;28(R2):R151-R161. doi: 10.1093/hmg/ddz197. Hum Mol Genet. 2019. PMID: 31411675 Free PMC article. Review.
  • Exploring hypertension genome-wide association studies findings and impact on pathophysiology, pathways, and pharmacogenetics.
    Cabrera CP, Ng FL, Warren HR, Barnes MR, Munroe PB, Caulfield MJ. Cabrera CP, et al. Wiley Interdiscip Rev Syst Biol Med. 2015 Mar-Apr;7(2):73-90. doi: 10.1002/wsbm.1290. Epub 2015 Feb 6. Wiley Interdiscip Rev Syst Biol Med. 2015. PMID: 25655479 Review.

Cited by

References

    1. Yang Q, Cogswell ME, Flanders W, et al. TRends in cardiovascular health metrics and associations with all-cause and cvd mortality among us adults. JAMA. 2012;307:1273–1283. - PMC - PubMed
    1. Levy D, et al. Framingham Heart Study 100K Project: genome-wide associations for blood pressure and arterial stiffness. BMC Med. Genet. 2007;8(Suppl 1):S3. - PMC - PubMed
    1. Miall WE, Oldham PD. The Hereditary Factor in Arterial Blood-pressure. Br. Med. J. 1963;1:75–80. - PMC - PubMed
    1. Fox ER, et al. Association of genetic variation with systolic and diastolic blood pressure among African Americans: the Candidate Gene Association Resource study. Hum. Mol. Genet. 2011;20:2273–2284. - PMC - PubMed
    1. Franceschini N, et al. Genome-wide Association Analysis of Blood-Pressure Traits in African-Ancestry Individuals Reveals Common Associated Genes in African and Non-African Populations. Am. J. Hum. Genet. 2013;93:545–554. - PMC - PubMed