. 2016 Dec;18(12):1311-1323.
doi: 10.1038/ncb3438. Epub 2016 Nov 14.

Engulfed cadherin fingers are polarized junctional structures between collectively migrating endothelial cells

Affiliations

Engulfed cadherin fingers are polarized junctional structures between collectively migrating endothelial cells

Arnold Hayer et al. Nat Cell Biol. 2016 Dec.

Abstract

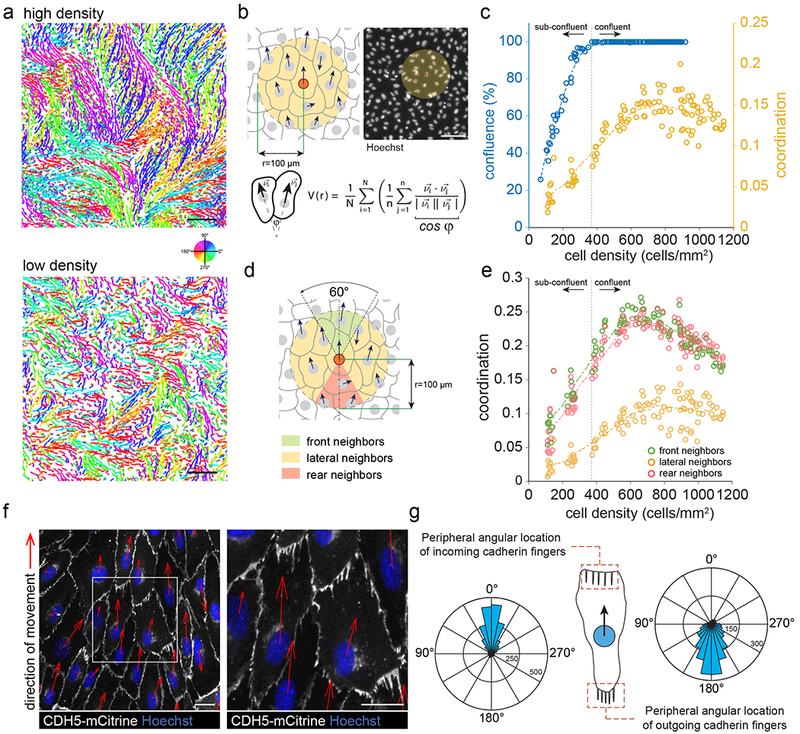
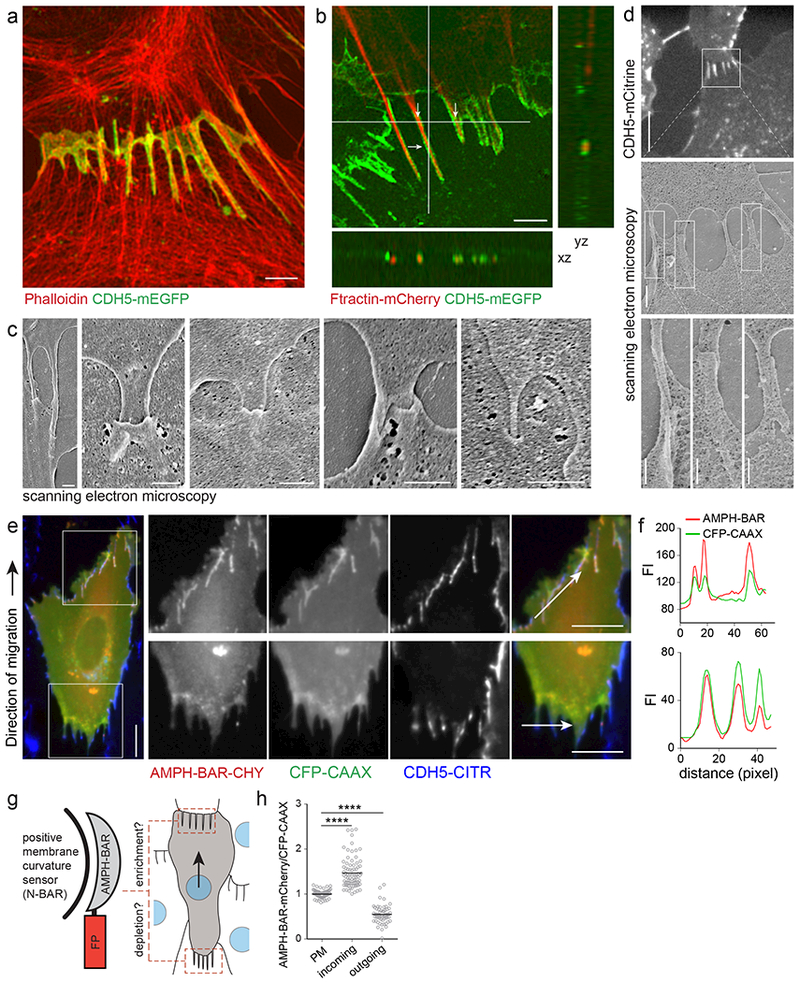
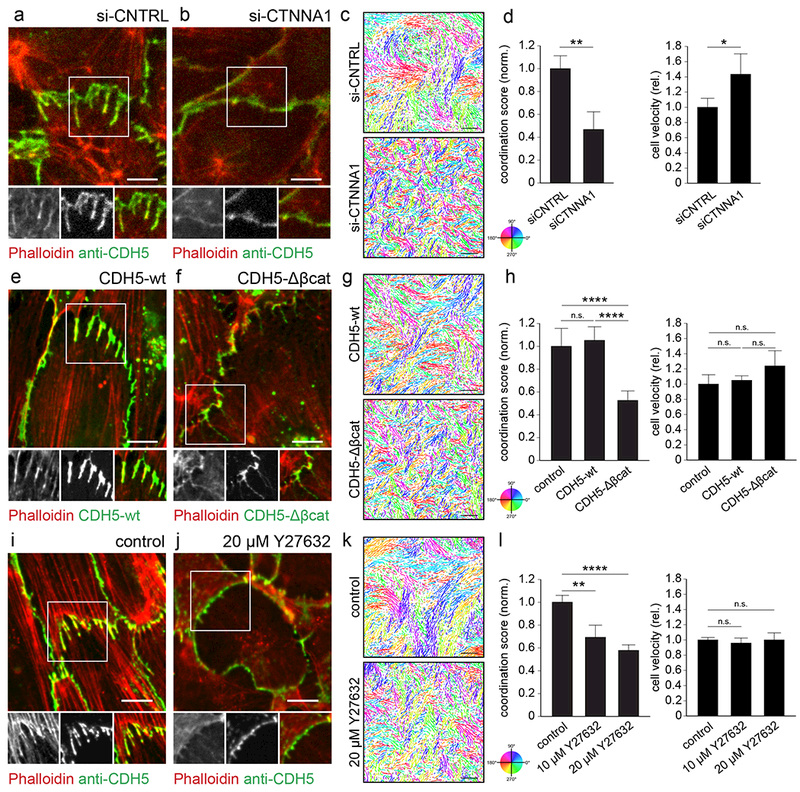
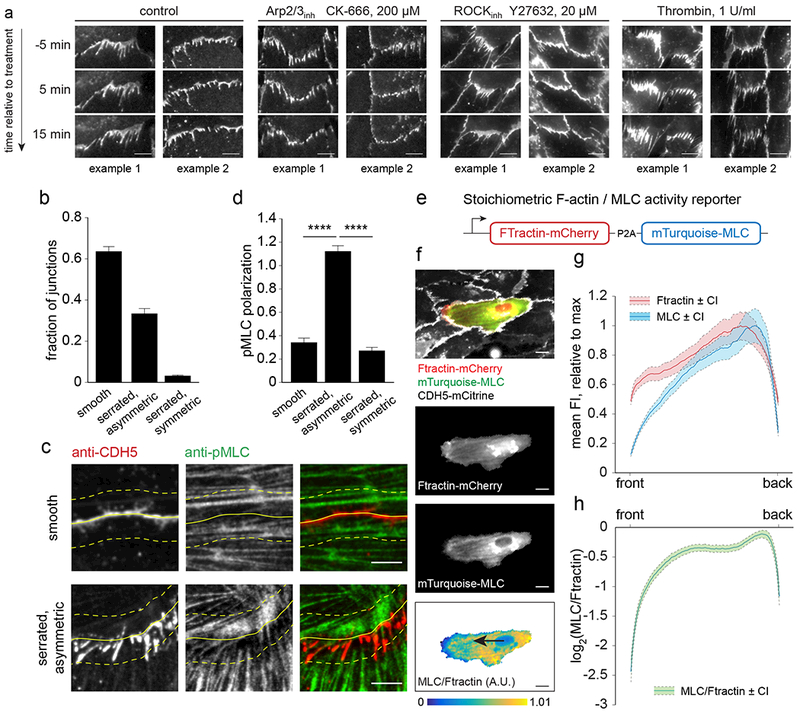
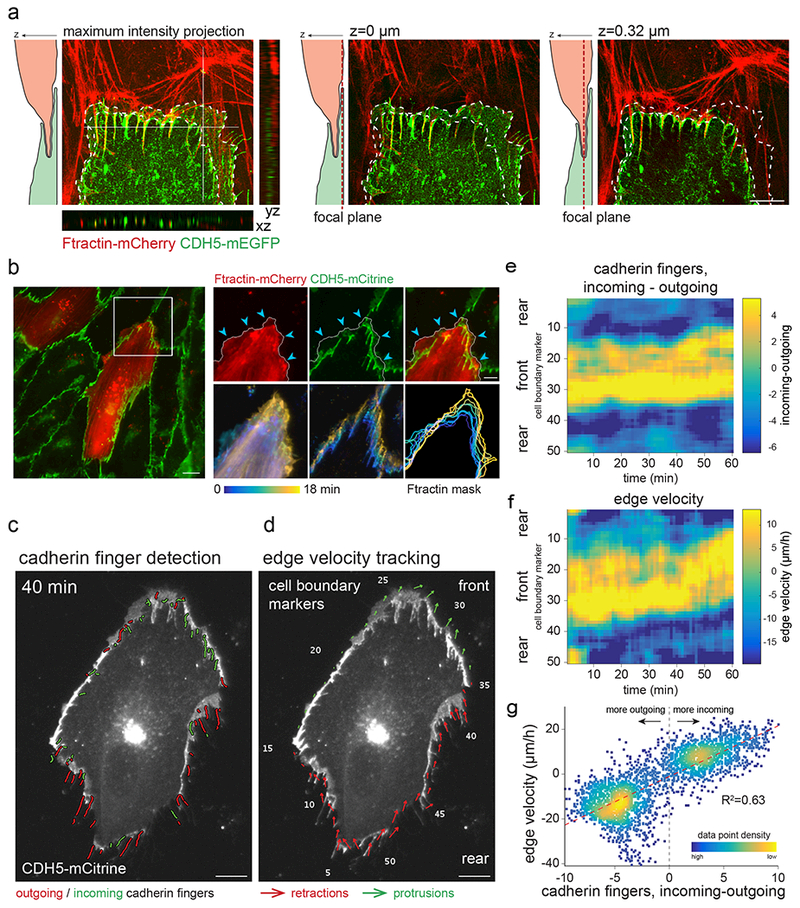
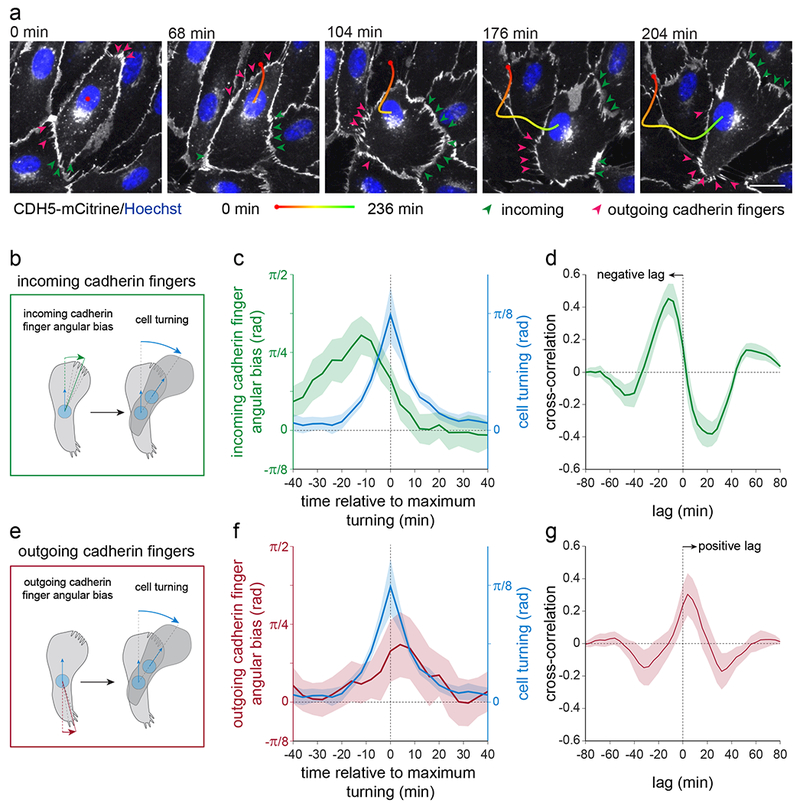
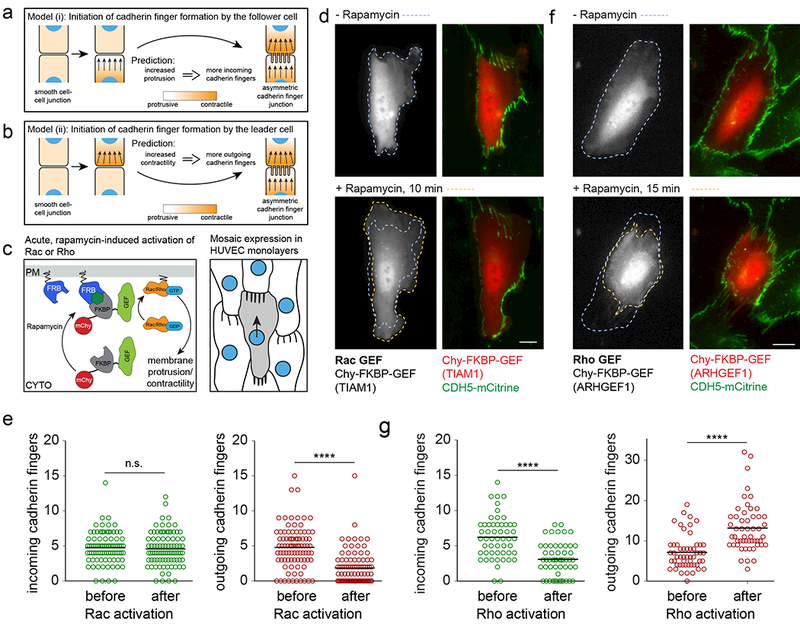
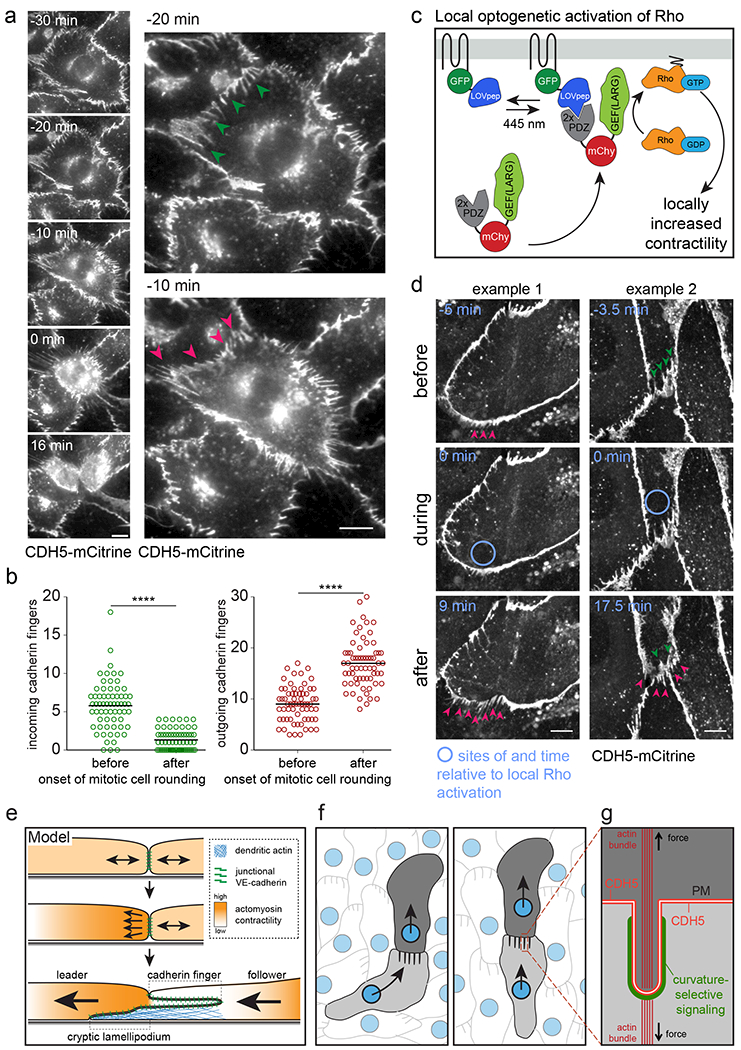
The development and maintenance of tissues requires collective cell movement, during which neighbouring cells coordinate the polarity of their migration machineries. Here, we ask how polarity signals are transmitted from one cell to another across symmetrical cadherin junctions, during collective migration. We demonstrate that collectively migrating endothelial cells have polarized VE-cadherin-rich membrane protrusions, 'cadherin fingers', which leading cells extend from their rear and follower cells engulf at their front, thereby generating opposite membrane curvatures and asymmetric recruitment of curvature-sensing proteins. In follower cells, engulfment of cadherin fingers occurs along with the formation of a lamellipodia-like zone with low actomyosin contractility, and requires VE-cadherin/catenin complexes and Arp2/3-driven actin polymerization. Lateral accumulation of cadherin fingers in follower cells precedes turning, and increased actomyosin contractility can initiate cadherin finger extension as well as engulfment by a neighbouring cell, to promote follower behaviour. We propose that cadherin fingers serve as guidance cues that direct collective cell migration.


Conflict of interest statement

Competing financial interests

The authors declare no competing financial interests.

Figures

Figure 1.
Figure 1.. Collectively migrating endothelial cells orient “cadherin fingers” backwards relative to the direction of movement.
(a) Unperturbed high- and low-density monolayers of HUVEC were stained with nuclear dye (Hoechst), imaged for 4 h at 10 min intervals, and nuclei were automatically tracked. Nuclear trajectories are colored based on the direction of movement. High-density (upper panel), but not low-density monolayers (lower panel) showed streams of highly coordinated cell movement. Scale bars, 250 μm. (b) Averaged pairwise velocity correlation between a given cell and its neighbors within a given radius as a metric for coordinated cell movement (Materials and Methods). Scale bar, 100 μm. (c) Coordinated cell movement and confluence as a function of cell density in unperturbed monolayers. For confluence, individual data points are confluence measured in 20x magnification fields of fixed and Hoechst/phalloidin-stained HUVEC cultures. For coordination, individual data points are averaged coordination measurements each from entire wells of 96-well plates, pooled from three independent experiments. (d) Averaged pairwise velocity correlation similar to (b), but between a cell and separately with its front, lateral, and rear neighbors. (e) Coordination with front, lateral, and rear neighbors as a function of cell density. Individual data points are averaged coordination measurements each from an entire well of a 96-well plate, pooled from three independent experiments. (f) Monolayers of HUVEC stably expressing fluorescently-tagged VE-cadherin (CDH5-mCitrine) were stained with Hoechst, time-lapse sequences were acquired, and the direction of movement of individual cells was determined through automated nuclear tracking (red arrows). Comb-shaped cadherin-positive structures (“cadherin fingers”) pointing away from the rear of cells towards their followers are visible. Scale bars, 20 μm (g) Rose plots of the angular location of incoming and outgoing cadherin fingers along the periphery of cells, relative to the direction of cell movement (Materials and Methods). Data pooled from n=522 cells, from three independent experiments.
Figure 2.
Figure 2.. Cadherin fingers are double membrane tubes extended from the back of leader cells and engulfed by the front of follower cells.
(a, b) 3D-SIM of HUVEC migrating bottom to top. (a) HUVEC stably expressing CDH5-mEGFP, fixed and stained with Phalloidin-AF594, show that cadherin fingers are extensively embedded within the actin cytoskeleton of the follower cell. Scale bar, 2 μm. (b) Two populations of HUVEC expressing either only Ftractin-mCherry or only CDH5-mEGFP were mixed and co-plated. Actin-rich, finger-like protrusions marked in the leader cell (top) are enveloped by CDH5-positive membranes originating from the follower cell (arrows, bottom). xz and yz cross-sections taken at the white lines show actin bundles of the leader cell enveloped by VE-cadherin from the follower cell. Scale bar, 2 μm. (c) Scanning electron microscopy (SEM) of endothelial cell-cell junctions shows finger-like protrusions engulfed by neighboring cells. Scale bars, 0.5 μm. (d) Correlated fluorescence (CDH5-mCitrine) and scanning electron microscopy (CLEM) of sparsely plated HUVEC reveals engulfed, finger-like structures at serrated cell-cell junctions. Scale bars, 10 μm (top), 1 μm (middle), and 0.5 μm (bottom). (e) HUVEC stably expressing CDH5-mCitrine and transfected with AMPH-BAR-mCherry and CFP-CAAX, a curvature-insensitive membrane marker, viewed by widefield-fluorescence microscopy. Incoming cadherin fingers (upper panels) show enrichment of AMPH-BAR-mCherry, whereas outgoing cadherin fingers (lower panels) show depletion of AMPH-BAR-mCherry relative to CFP-CAAX. Scale bars, 10 μm. (f) Intensity profiles of AMPH-BAR-mCherry and CFP-CAAX along the arrows in the image shown in (e). (g) Schematic of AMPH-BAR-FP, a fluorescent protein-conjugated N-BAR positive membrane curvature reporter and rationale of the enrichment/depletion analysis. (h) Statistical analysis of the enrichment and depletion of AMPH-BAR on the surface of incoming and outgoing cadherin fingers, respectively, relative to a curvature insensitive membrane marker CFP-CAAX (Materials and Methods). Individual measurements and means of n=137 cadherin fingers from 21 cells, pooled from two independent experiments. **** p<0.0001, Kruskal Wallis ANOVA/Dunn.
Figure 3.
Figure 3.. A cadherin/catenin-based link between cells is required for cadherin finger formation and coordinated cell migration, but not for autonomous migration.
(a, b) HUVEC were transfected with either control siRNA or siRNA targeting α-catenin (CTNNA1), the cytoplasmic actin adapter of the cadherin/catenin complex. Polarized cadherin fingers were lost in α-catenin-depleted cells. Scale bars, 10 μm. (e, f) HUVEC stably expressing either fluorescently-tagged wild-type (CDH5-wt) or truncated VE-cadherin lacking the cytoplasmic beta-catenin binding domain (CDH5-Δβcat). Polarized cadherin fingers (e) were lost upon CDH5-Δβcat-expression (f). Scale bars, 10 μm. (i, j) HUVEC were either treated with the ROCK inhibitor Y27632 (20 μM) or left untreated. Polarized cadherin fingers (i) were lost in Y27632-treated cells (j). Scale bar, 10 μm. (c, g ,k) Cells migrating in monolayers were imaged for 2 h at 10 min intervals, their nuclei tracked, and the resulting trajectories colored according to their direction of movement to illustrate the extent of coordinated movement. Scale bars, 250 μm. Depletion of α-catenin (c-d), overexpression of truncated VE-cadherin (g-h), and ROCK inhibition (k-l) all caused a decrease in the extent of coordinated cell migration, but did not slow down individual cell migration. Bars are means ± S.D., n=3 independent experiments (d, h) or n=7 wells pooled from two independent experiments (l). * p<0.05, ** p<0.01, **** p<0.0001, (d) Student t-test, (h) ANOVA/Tukey, (i) Kruskal Wallis ANOVA/Dunn.
Figure 4.
Figure 4.. Polarization of cadherin fingers requires continued Arp2/3-driven actin polymerization and asymmetric actomyosin contractility.
(a) HUVEC expressing CDH5-mCitrine were control treated or treated with an Arp2/3 inhibitor (CK666, 200 μM), a ROCK inhibitor (Y27632, 20 μM), or Thrombin (1U/ml) during the acquisition of time-lapse sequences. Cadherin fingers were lost upon Arp2/3 and ROCK inhibition, whereas Thrombin treatment caused cadherin fingers to point both ways. (b-d) Asymmetric phospho-myosin light chain (pMLC) distribution at asymmetric cell-cell junctions. (b) The fraction of (i) smooth, (ii) serrated/asymmetric and (iii) serrated/symmetric cell-cell contacts in HUVEC fixed and stained with phalloidin/anti-pMLC/anti-CDH5. 916 cell-cell junctions were analyzed, bars are means ±S.D. from n=3 independent experiments. (c-d) In serrated, asymmetric cell-cell contacts of control cells, pMLC signal was enriched near where cadherin fingers originated in the donor cells and locally depleted near incoming cadherin fingers in the acceptor cell. No gradients in pMLC signal could be observed in smooth contacts. Solid yellow lines indicate cell boundaries, dashed lines outline regions where pMLC signal was enriched/depleted in case of serrated/asymmetric, but not smooth cell-cell contacts. (d) pMLC intensity in two areas on opposite sides of smooth, serrated asymmetric, or serrated symmetric cell-cell contacts was measured and a normalized ratio expressed as pMLC polarization. Bars are means ±S.E.M. from n=52 measurements per junction type, pooled from two independent experiments. **** p<0.0001, Kruskal Wallis ANOVA/Dunn. (e) Schematic of the stoichiometric F-actin (Ftractin-mCherry) and myosin II activity (mTurquoise-MLC) reporter used. (f-h) Mosaic experiment of cells either expressing CDH5-mCitrine alone or coexpressing CDH5-mCitrine and Ftractin-mCherry-P2A-mTurquoise-MLC to determine front-back activity profiles of myosin activity in migrating cells. Time-lapse sequences acquired at 5 min intervals were used to track cells expressing Ftractin-mCherry-P2A-mTurquoise-MLC for 45 min. (f) Example of a cell expressing Ftractin-mCherry-P2A-mTurquoise-MLC surrounded by CDH5-mCitrine expressing cells. Masking was done based on Ftractin-mCherry signal and the relative myosin II activity calculated as the ratio of mTurquoise-MLC and Ftractin-mCherry intensities. (g,h) Front-back profiles of Ftractin-mCherry, mTurquoise-MLC, and the ratio mTurquoise-MLC/Ftractin-mCherry show a depletion of myosin activity in the front. Mean profiles ±95% confidence intervals from n=181 cells, pooled from two independent experiments. Scale bars, 10 μm
Figure 5.
Figure 5.. Incoming cadherin fingers are spatially and temporally correlated with locally extending cryptic lamellipodia.
(a, b) Incoming cadherin fingers are associated with local protrusive, lamellipodial activity. (a) 3D-SIM of the junctional region between an Ftractin-mCherry (top) and a CDH5-mCitrine (bottom) expressing cell. Optical z-sectioning shows cryptic lamellipodial activity (arrowheads) near incoming cadherin fingers. xz and yz sections were stretched 2x in z-direction. Scale bar, 5 μm. (b) A mosaic monolayer of HUVEC either stably expressing CDH5-mCitrine alone or coexpressing CDH5-mCitrine+Ftractin-mCherry, plated at 10:1, and imaged at 2 min intervals. Protrusive lamellipodial activity was observed in the front of the Ftractin-mCherry-expressing cell, near incoming cadherin fingers. Enlargements show protrusions (upper right, arrowheads) and temporally color-coded Ftractin-mCherry/CDH5-mCitrine signals, as well as a temporally color-coded outline of the Ftractin-mCherry mask (lower right). Scale bars, 10 μm (left), 5 μm (right). (c-g) Individual HUVEC expressing CDH5-mCitrine in mosaic monolayers with HUVEC expressing CDH5-mRuby3 (plated at 1:10, CDH5-mRuby3 not shown) were imaged at 1 min intervals. Segmented incoming and outgoing cadherin fingers (c) and local edge velocity (d) were determined based on CDH5-mCitrine and CDH5-mRuby3 signal (Materials and Methods). Velocity arrows reflect movement of boundary markers averaged over 7 minutes and scaled 10x for visualization. Scale bars, 10μm. (e) Incoming cadherin finger bias, computed as incoming - outgoing cadherin fingers within overlapping windows of 5 boundary markers and averaged over 7 minutes, was plotted for all cell boundary markers over 1 h to generate a spatio-temporal map of cadherin finger presence and orientation. (f) Similarly, local edge velocity was plotted for equivalent peripheral windows to generate a spatio-temporal edge velocity map. (g) Correlation between incoming cadherin finger bias and local edge velocity as computed in (e, f) plotted against each other demonstrate that peripheral regions with more incoming cadherin fingers protrude, whereas regions with more outgoing cadherin fingers retract. Data for additional cells shown in Supplementary Figure 4.
Figure 6.
Figure 6.. Increased localization of incoming cadherin fingers towards the left or right front region precedes cell turning.
(a-g) HUVEC stably expressing CDH5-mCitrine and stained with nuclear dye (Hoechst) were imaged at 4 min intervals for 4 h. Turning cells were identified based on nuclear tracks and analyzed for the presence and localization of incoming/outgoing cadherin fingers along their periphery prior, during, and after the turning events (Materials and Methods). (a) Example of a cell during a turning event. Incoming and outgoing cadherin fingers are highlighted by green and red arrowheads, respectively. Scale bar, 20 μm. (b) Schematic for quantitative analysis of incoming cadherin finger angular bias and cell turning, calculated as the mean angular deviation of all incoming cadherin fingers, located along a cell’s periphery, from the direction of cell movement, at a given time point (Materials and Methods). (c) Evolution over time of cell turning and incoming cadherin finger angular bias during turning events, aligned to the time point of maximum turning. (d) Temporal cross-correlation between incoming cadherin finger angular bias and cell turning showed that incoming cadherin finger angular bias preceded cell turning. (e-g) Analogous analysis as in (b-d) for outgoing cadherin finger angular bias and cell turning. Outgoing cadherin finger angular bias followed cell turning. (c-d, f-g), means ± 95% confidence intervals for n=33 cells, pooled from 2 independent experiments.
Figure 7.
Figure 7.. Increased contractility in leader cells triggers polarized cadherin finger formation and engulfment by follower cells.
(a,b) Schematics for models where cadherin finger formation is initiated by the future follower (a) or the future leader cell (b). (c) Schematic illustrating the strategies to synthetically activate Rac and Rho in individual cells in monolayers of HUVEC expressing CDH5-mCitrine. (d) Activation of Rac by addition of Rapamycin (0.5 μM) to cells transiently cotransfected with Lyn11-FRB and mCherry-FKBP-GEF(TIAMl) induces protrusive actin polymerization leading to increased cell spreading. Scale bar, 10 μm. (e) Changes of the number of incoming and outgoing cadherin fingers along the cell periphery of cells, before and 10 min after the synthetic activation of Rac. n=89 cells from two independent experiments were analyzed, individual measurements and means are shown. **** p<0.0001, Wilcoxon signed rank test. (f) Activation of Rho by addition of Rapamycin (0.1 μM) to cells transiently cotransfected with Lyn11-FRB and mCherry-FKBP-GEF(ARHGEFl) induces a contractile response. Scale bars, 10 μm. (g) Changes of the number of incoming and outgoing cadherin fingers along the cell periphery of cells, before and 15 min after the synthetic activation of Rho. n=53 cells from 3 independent experiments were analyzed, individual measurements and means are shown. **** p<0.0001, Wilcoxon signed rank test.
Figure 8.
Figure 8.. Cadherin finger formation at the onset of mitotic cell rounding and following optogenetic Rho activation.
(a) Live-cell imaging of HUVEC expressing CDH5-mCitrine during the onset of mitotic cell rounding. Timestamps are times relative to the completion of mitotic cell rounding. Green arrowheads point towards incoming cadherin fingers that flip to become outgoing cadherin fingers (red arrowheads). Scale bars, 10 μm. (b) Change of the number of incoming and outgoing cadherin fingers along the cell periphery of cells going into mitosis, within an 8 min interval before and after the onset of mitotic cell rounding. n=65 cells from two independent experiments were analyzed, individual measurements and means are shown. **** p<0.0001, Wilcoxon signed rank test. (c) Strategy to locally activate Rho using optogenetics in individual cells in monolayers of HUVEC expressing CDH5-mCitrine. (d) Local light-mediated Rho activation in cells transiently cotransfected with Stargazin-GFP-LOVpep and (PDZ)2-mCherry-GEF(LARG) caused locally increased formation of outgoing cadherin fingers. Green/red arrowheads indicate incoming/outgoing cadherin fingers. Scale bars, 10 μm. (e) Cadherin fingers are characteristic membrane and actin structures at the interface between leader and follower cells. Their formation is initiated by increased contractility at the rear of the future leader cell. The follower cell responds to support cadherin finger engulfment and extends local cryptic lamellipodia. (f) Leader-follower cell relationships are maintained by cadherin fingers that leaders extend from their rear and followers engulf in their front. Incoming cadherin fingers may bias the autonomous migration machinery of follower cells to follow the leader by favoring local protrusion events. (g) The surface of incoming, engulfed cadherin fingers may serve as a platform for recruitment of curvature-selective regulators to bias cell-autonomous signaling gradients supporting collective cell migration (see main text).

Comment in

References

    1. Friedl P & Gilmour D Collective cell migration in morphogenesis, regeneration and cancer. Nat. Rev. Mol. Cell Biol 10, 445–57 (2009). - PubMed
    1. Mayor R & Etienne-Manneville S The front and rear of collective cell migration. Nat. Rev. Mol. Cell Biol 17, 97–109 (2016). - PubMed
    1. Cai D et al. Mechanical Feedback through E-Cadherin Promotes Direction Sensing during Collective Cell Migration. Cell 157, 1146–1159 (2014). - PMC - PubMed
    1. Reffay M et al. Interplay of RhoA and mechanical forces in collective cell migration driven by leader cells. Nat. Cell Biol 16, 217–223 (2014). - PubMed
    1. Ng MR, Besser A, Danuser G & Brugge JS Substrate stiffness regulates cadherin-dependent collective migration through myosin-II contractility. J. Cell Biol 199, 545–63 (2012). - PMC - PubMed

Supplementary References

    1. Young L, Sung J, Stacey G & Masters JR Detection of Mycoplasma in cell cultures. Nat. Protoc 5, 929–34 (2010). - PubMed
    1. Bajar BT et al. Improving brightness and photostability of green and red fluorescent proteins for live cell imaging and FRET reporting. Sci. Rep 6, 20889 (2016). - PMC - PubMed
    1. Gibson DG et al. Enzymatic assembly of DNA molecules up to several hundred kilobases. Nat. Methods 6, 343–5 (2009). - PubMed
    1. Conway DE et al. Fluid Shear Stress on Endothelial Cells Modulates Mechanical Tension across VE-Cadherin and PECAM-1. Curr. Biol 23, 1024–30 (2013). - PMC - PubMed
    1. Wollman R & Meyer T Coordinated oscillations in cortical actin and Ca2+ correlate with cycles of vesicle secretion. Nat. Cell Biol 14, 1261–9 (2012). - PMC - PubMed

MeSH terms