. 2016 Dec;18(12):1302-1310.
doi: 10.1038/ncb3439. Epub 2016 Nov 14.

Developmentally programmed germ cell remodelling by endodermal cell cannibalism

Affiliations

Developmentally programmed germ cell remodelling by endodermal cell cannibalism

Yusuff Abdu et al. Nat Cell Biol. 2016 Dec.

Abstract

Primordial germ cells (PGCs) in many species associate intimately with endodermal cells, but the significance of such interactions is largely unexplored. Here, we show that Caenorhabditis elegans PGCs form lobes that are removed and digested by endodermal cells, dramatically altering PGC size and mitochondrial content. We demonstrate that endodermal cells do not scavenge lobes PGCs shed, but rather, actively remove lobes from the cell body. CED-10 (Rac)-induced actin, DYN-1 (dynamin) and LST-4 (SNX9) transiently surround lobe necks and are required within endodermal cells for lobe scission, suggesting that scission occurs through a mechanism resembling vesicle endocytosis. These findings reveal an unexpected role for endoderm in altering the contents of embryonic PGCs, and define a form of developmentally programmed cell remodelling involving intercellular cannibalism. Active roles for engulfing cells have been proposed in several neuronal remodelling events, suggesting that intercellular cannibalism may be a more widespread method used to shape cells than previously thought.


Figures

Figure 1
Figure 1. PGC lobes form autonomously and are digested by endodermal cells
(a) PGC and endoderm prior to lobe formation (bean stage); only one PGC is visible in the focal plane. (b) A PGC after lobe formation (1½-fold embryo). The lobe (‘L’) has embedded into the endoderm. (c-c’) PGCs in L1 larvae; PGC lobe debris (arrowheads) is present within adjacent endodermal cells. (d-d’) Time-lapse stills of PGCs on the surface of an end-1 end-3 mutant embryo before (d) and after (d’) forming lobes. (e-e’) A single PGC in cell culture before a lobe forms (e) and after a lobe forms and bifurcates (3’); ‘L’, lobes. Stills taken from Supplementary Movie 3. (f-f’) GFP-RAB-7 (arrow) marking the surface of a lobe in within a late embryo. (g-g’) Lobe debris is marked with LMP-1-GFP (arrow). *, PGC cell body. Scale bar, 5μm.
Figure 2
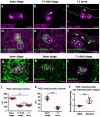
Figure 2. Lobe loss remodels PGC contents
(a-c) P granules localize to the nuclear periphery prior to lobe formation (a). Some P granules move into lobes (b, arrow) and become digested by endodermal cells (c, arrowhead; dashed lines indicate endoderm). Panels a,b are from Supplementary Video 4. (d-f) PGC mitochondria before (d) and after (e) lobe formation, and as debris within endodermal cells in L1 (f, arrowheads). Panels d,e are from Supplementary Video 5. (g) Mitochondrial membrane potential dye TMRE labels mitochondria in PGCs and soma at equal levels. (h,i) Compared to levels in soma, mitochondrial oxidant dye MitoSOX labels PGC mitochondria strongly before (h) and after (i) lobes form. (j) Quantification of PGC cell body volume (bean, n=14; 1½-fold, n=14; L1, n=14 from 1 out of 3 independent experiments. Source data for repeat experiments is provided in Supplementary Table 3). (k) Quantification of mitochondria loss, (bean stage, n=12 embryos; L1, n=14 L1 larvae from 1 out of 2 independent experiments. Source data for repeat experiments is provided in Supplementary Table 3). (l) Quantification of fluorescence intensity of TMRE (n=10 embryos) and MitoSOX (n=10 embryos) labeling in PGC mitochondria normalized to average intensity levels in the soma. Data shown is from 1 out of 2 independent experiment. Source data for repeat experiments is provided in Supplementary Table 3. Mean (red bar) ± S.D shown. Scale bar, 5μm. *** p < 0.001, unpaired Student’s t-test. *, PGC cell body.
Figure 3
Figure 3. Endodermal cells actively remove PGC lobes
(a-b) FRAP of mCh-MemPGC in PGC lobes in 2-fold (a) and 3-fold (b) stage wild-type (WT) embryos. (c) Quantification of FRAP in 3-fold embryos showing examples of recovered and unrecovered lobes (n=10 lobes in 10 embryos each class, mean ± S.D shown). (d) Percent lobe recovery in WT and end-1 end-3 2-fold and 3-fold embryos (***p < 0.001, Fisher’s exact test). (e) Pedigrees tracking Z2 and Z3 lobe formation and degradation in three representative embryos. Lobe formation or bifurcation (‘O’) and degradation (‘X’) are indicated. (f) Z2 and Z3 lobe formation and degradation in nine embryos. Dotted vertical lines connect initial lobe formation (triangle) to final degradation of the lobe descendants (circle) from a single PGC (n=9 embryos). (g-h) PGC lobes are digested in WT L1 larvae (g), but persist in end-1 end-3 L1 larvae (h). (i) FRAP of all persistent lobes in end-1 end-3 L1 larvae (recovery in 14/14 L1). (j-k) PGCs retain higher mitochondrial content in end-1 end-3 L1 larvae (k) compared to WT L1 larvae (j). (l) Quantification of mitochondria retention (WT: n=10 embryos, 11 L1 larvae; end-1 end-3: n=10 embryos, 10 L1 larvae). Data shown is from 1 out of 2 independent experiments. Source data for repeat experiments is provided in Supplementary Table 3. Mean ± S.D shown. Scale bar, 5μm. *** p < 0.001, unpaired Student’s t-test. *, PGC cell body.
Figure 4
Figure 4. Endodermal cell CED-10/Rac induces actin formation to promote lobe scission
(a) Pedigree of lobe formation (‘O’) and degradation (‘X’) in a ced-10 mutant. (b-b”) Persistent lobes in a ced-10 L1 larva; membrane stalk connecting lobe to cell body is indicated by arrows. (c) FRAP of persistent lobes in ced-10 L1 larva (recovery in 19/19 L1). (d) Endoderm-specific expression of ced-10(+) (from xnEx375) rescues ced-10(n1993) persistent lobes (n=14 L1 larvae). (e) Number of PGC debris particles in WT and ced-10 mutants (mean± S.D, *** p < 0.001, Student’s unpaired t-test). n= 14 L1 larvae from 1 out of 3 independent experiments. Source data for repeat experiments is provided in Supplementary Table 3. (f) Localization of YFP-ACT-5END (arrow) at a lobe neck. (g) Percentage of lobes with actin localization events in WT and ced-10 mutants (*** p < 0.001, Fisher’s exact test). n=15 lobes in 6 embryos (WT) and n=23 lobes in 6 embryos (ced-10) acquired from lightsheet data. (h) Pedigree of lobes and lobe-neck actin appearance in WT and ced-10 mutants. Scale bar, 5μm.
Figure 5
Figure 5. Endodermal LST-4/SNX9 and dynamin act to promote lobe scission
(a-b) Persistent lobes (arrow) in lst-4(xn45) mutants (a; arrowhead, lobe debris) and lst-4(RNAi) (b) L1 larvae. (c) Localization of LST-4-YFPEND (arrow) at a lobe neck. (d) Rescue of persistent lobes in lst-4(xn45) L1 by LST-4-YFPEND; arrowhead indicates debris (persistent lobes in 0/90 L1, compared to 40/40 siblings lacking LST-4-YFPEND from 3 independent experiments). (e) FRAP of persistent lobes in lst-4(RNAi) L1 larvae (recovery in 15/15 L1 from 3 independent experiments). (f-g) dyn-1 mutant (g) and rescued (f) embryos; persistent lobes in dyn-1 embryos indicated by arrows, debris in rescued embryos marked by arrowhead. (h) YFP-DYN-1END localizes to lobe necks (arrow). (i) YFP-DYN-1END rescues persistent lobe defects of dyn-1 mutant embryos (arrowhead, debris). (j) FRAP of persistent lobes in dyn-1 mutant embryos (recovery in 16/16 embryos, compared to 4/11 dyn-1; dyn-1(+) embryos from 3 independent experiments). Scale bar, 5μm.
Figure 6
Figure 6. A pathway for lobe scission
(a) Pedigree of lobes and dynamin localization at lobe necks in wild-type and ced-10 mutant embryos. (b-b”) Colocalization of YFP-ACT-5END and CFP-DYN-1 at lobe necks; arrowhead denotes colocalization whereas arrows point to lobes that are marked predominantly by YFP-ACT-5END. (c) Quantification of actin localization in dyn-1 rescued embryos and dyn-1 mutant embryos (N.S., Not Significant, Fisher’s exact test. Data shown from two independent experiments). (d) Quantification of actin and dynamin localization at lobe necks in control and lst-4(RNAi) 3-fold embryos (*** p < 0.001, Fisher’s exact test. Data shown from 4 independent experiments). (e) Quantification of LST-4 localization in wild type and ced-10 mutant embryos (N.S., Not Significant, Fisher’s exact test. Data shown from 3 independent experiments). (f) A cartoon representation of lobe cannibalism. PGCs form organelle-rich lobes that embed into adjacent endodermal cells. Through a pathway outlined below, lobes undergo scission from PGCs and become digested in endodermal cells. Scale bar, 5μm.

Comment in

References

    1. Cinalli RM, Rangan P, Lehmann R. Germ cells are forever. Cell. 2008;132:559–562. - PubMed
    1. Seydoux G, Braun RE. Pathway to totipotency: lessons from germ cells. Cell. 2006;127:891–904. - PubMed
    1. Molyneaux KA, Stallock J, Schaible K, Wylie C. Time-lapse analysis of living mouse germ cell migration. Dev Biol. 2001;240:488–498. - PubMed
    1. Takamura K, Fujimura M, Yamaguchi Y. Primordial germ cells originate from the endodermal strand cells in the ascidian Ciona intestinalis. Dev Genes Evol. 2002;212:11–18. - PubMed
    1. Chihara D, Nance J. An E-cadherin-mediated hitchhiking mechanism for C. elegans germ cell internalization during gastrulation. Development. 2012;139:2547–2556. - PMC - PubMed