A novel phase variant of the cholera pathogen shows stress-adaptive cryptic transcriptomic signatures
- PMID: 27842489
- PMCID: PMC5109742
- DOI: 10.1186/s12864-016-3233-x
A novel phase variant of the cholera pathogen shows stress-adaptive cryptic transcriptomic signatures
Abstract
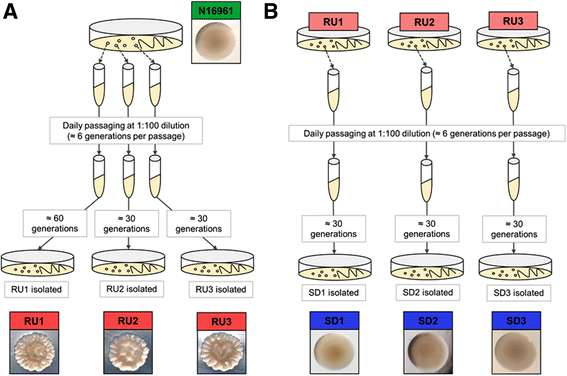
Background: In a process known as phase variation, the marine bacterium and cholera pathogen Vibrio cholerae alternately expresses smooth or rugose colonial phenotypes, the latter being associated with advanced biofilm architecture and greater resistance to ecological stress. To define phase variation at the transcriptomic level in pandemic V. cholerae O1 El Tor strain N16961, we compared the RNA-seq-derived transcriptomes among the smooth parent N16961, its rugose derivative (N16961R) and a smooth form obtained directly from the rugose at high frequencies consistent with phase variation (N16961SD).
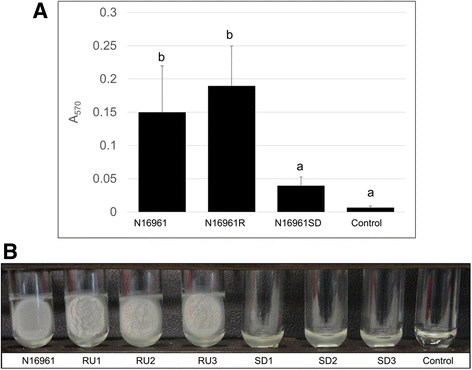
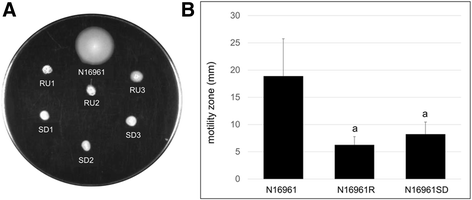
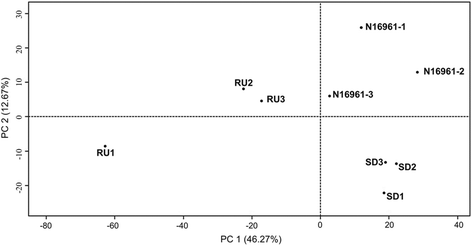
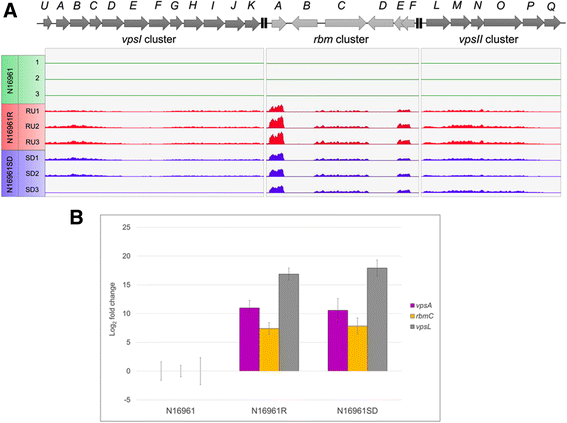
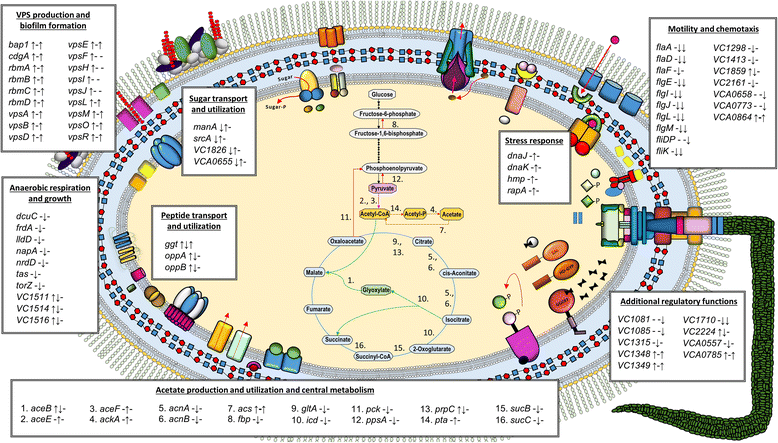
Results: Differentially regulated genes which clustered into co-expression groups were identified for specific cellular functions, including acetate metabolism, gluconeogenesis, and anaerobic respiration, suggesting an important link between these processes and biofilm formation in this species. Principal component analysis separated the transcriptome of N16961SD from the other phase variants. Although N16961SD was defective in biofilm formation, transcription of its biofilm-related vps and rbm gene clusters was nevertheless elevated as judged by both RNA-seq and RT-qPCR analyses. This transcriptome signature was shared with N16961R, as were others involving two-component signal transduction, chemotaxis, and c-di-GMP synthesis functions.
Conclusions: Precise turnarounds in gene expression did not accompany reversible phase transitions (i.e., smooth to rugose to smooth) in the cholera pathogen. Transcriptomic signatures consisting of up-regulated genes involved in biofilm formation, environmental sensing and persistence, chemotaxis, and signal transduction, which were shared by N16961R and N16961SD variants, may implicate a stress adaptation in the pathogen that facilitates transition of the N16961SD smooth form back to rugosity should environmental conditions dictate.
Keywords: Bioinformatics; Cholera; Phase variation; RNA sequencing; Transcriptomics; Vibrio cholerae.
Figures
Similar articles
-
High-frequency rugose exopolysaccharide production by Vibrio cholerae strains isolated in Haiti.PLoS One. 2014 Nov 12;9(11):e112853. doi: 10.1371/journal.pone.0112853. eCollection 2014. PLoS One. 2014. PMID: 25390633 Free PMC article.
-
The rbmBCDEF gene cluster modulates development of rugose colony morphology and biofilm formation in Vibrio cholerae.J Bacteriol. 2007 Mar;189(6):2319-30. doi: 10.1128/JB.01569-06. Epub 2007 Jan 12. J Bacteriol. 2007. PMID: 17220218 Free PMC article.
-
RNA-seq analysis identifies new genes regulated by the histone-like nucleoid structuring protein (H-NS) affecting Vibrio cholerae virulence, stress response and chemotaxis.PLoS One. 2015 Feb 13;10(2):e0118295. doi: 10.1371/journal.pone.0118295. eCollection 2015. PLoS One. 2015. PMID: 25679988 Free PMC article.
-
Expression of Vibrio cholerae virulence genes in response to environmental signals.Curr Issues Intest Microbiol. 2002 Sep;3(2):29-38. Curr Issues Intest Microbiol. 2002. PMID: 12400636 Review.
-
Genetic components of stringent response in Vibrio cholerae.Indian J Med Res. 2011 Feb;133(2):212-7. Indian J Med Res. 2011. PMID: 21415497 Free PMC article. Review.
Cited by
-
Diverse Horizontally-Acquired Gene Clusters Confer Sucrose Utilization to Different Lineages of the Marine Pathogen Photobacterium damselae subsp. damselae.Genes (Basel). 2020 Oct 22;11(11):1244. doi: 10.3390/genes11111244. Genes (Basel). 2020. PMID: 33105683 Free PMC article.
-
Genome-wide detection of conservative site-specific recombination in bacteria.PLoS Genet. 2018 Apr 5;14(4):e1007332. doi: 10.1371/journal.pgen.1007332. eCollection 2018 Apr. PLoS Genet. 2018. PMID: 29621238 Free PMC article.
-
Metabolic Proteins Expression Up-Regulated in Blood-Borne Extensively Drug-Resistant Salmonella Typhi Isolates from Pakistan.Medicina (Kaunas). 2024 Aug 27;60(9):1404. doi: 10.3390/medicina60091404. Medicina (Kaunas). 2024. PMID: 39336445 Free PMC article.
-
Ubiquitous purine sensor modulates diverse signal transduction pathways in bacteria.Nat Commun. 2024 Jul 12;15(1):5867. doi: 10.1038/s41467-024-50275-3. Nat Commun. 2024. PMID: 38997289 Free PMC article.
References
MeSH terms
Substances
LinkOut - more resources
Full Text Sources
Other Literature Sources
Medical
Molecular Biology Databases

