

Heterogeneous response and progression patterns reveal phenotypic heterogeneity of tyrosine kinase inhibitor response in metastatic renal cell carcinoma
- PMID: 27842541
- PMCID: PMC5108081
- DOI: 10.1186/s12916-016-0729-9
Heterogeneous response and progression patterns reveal phenotypic heterogeneity of tyrosine kinase inhibitor response in metastatic renal cell carcinoma
Abstract
Background: Molecular intratumour heterogeneity (ITH) is common in clear cell renal carcinomas (ccRCCs). However, it remains unknown whether this is mirrored by heterogeneity of drug responses between metastases in the same patient.
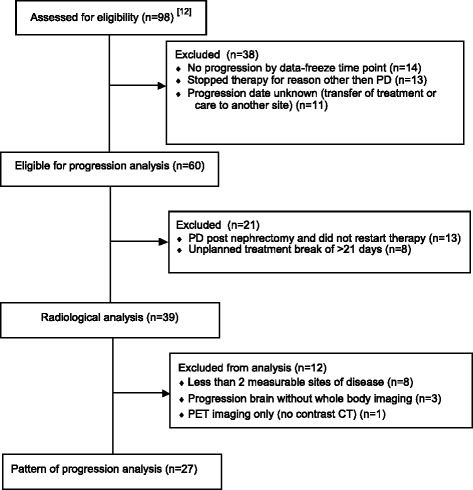
Methods: We performed a retrospective central radiological analysis of patients with treatment-naïve metastatic ccRCC receiving anti-angiogenic tyrosine kinase inhibitors (TKIs) (sunitinib or pazopanib) within three similar phase II trials. Treatment was briefly interrupted for cytoreductive nephrectomy. All patients had multiple metastases that were measured by regular computed tomography scans from baseline until Response Evaluation Criteria In Solid Tumours (RECIST)-defined progression. Each metastasis was categorised as responding, stable or progressing. Patients were classed as having a homogeneous response if all lesions were of the same response category and a heterogeneous response if they differed.
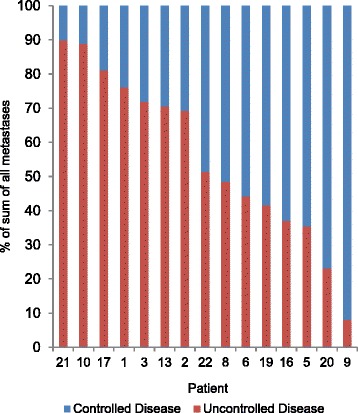
Results: A total of 115 metastases were assessed longitudinally in 27 patients. Of these patients, 56% had a heterogeneous response. Progression occurred through the appearance of new metastases in 67%, through progression of existing lesions in 11% and by both in 22% of patients. Despite RECIST-defined progression, 57% of existing metastases remained controlled. The sum of controlled lesions was greater than that of uncontrolled lesions in 47% of patients who progressed only with measurable new lesions.
Conclusions: We identified frequent ITH of anti-angiogenic TKI responses, with subsets of metastases responding and progressing within individual patients. This mirrors molecular ITH and may indicate that anti-angiogenic drug resistance is confined to subclones and not encoded on the trunk of the tumours' phylogenetic trees. This is clinically important, as patients with small-volume progression may benefit from drug continuation. Predominant progression with new rather than in existing metastases supports a change in disease biology through anti-angiogenics. The results highlight limitations of RECIST in heterogeneous cancers, which may influence clinical trial data validity. This analysis requires prospective confirmation.
Trial registration: European Clinical Trials Database(EudraCT): 2009-016675-29 , registered 17 March 2010; EudraCT: 2006-004511-21 , registered 09 March 2007; EudraCT: 2006-006491-38 , registered 22 December 2006.
Keywords: Anti-angiogenic treatment; Drug resistance; Intratumour heterogeneity; Kidney cancer; RECIST.
Figures


References
-
- Voss MH, Hakimi AA, Pham CG, Brannon AR, Chen YB, Cunha LF, Akin O, Liu H, Takeda S, Scott SN, et al. Tumor genetic analyses of patients with metastatic renal cell carcinoma and extended benefit from mTOR inhibitor therapy. Clin Cancer Res. 2014;20(7):1955–64. doi: 10.1158/1078-0432.CCR-13-2345. - DOI - PMC - PubMed
-
- Gulati S, Martinez P, Joshi T, Birkbak NJ, Santos CR, Rowan AJ, Pickering L, Gore M, Larkin J, Szallasi Z, et al. Systematic evaluation of the prognostic impact and intratumour heterogeneity of clear cell renal cell carcinoma biomarkers. Eur Urol. 2014;66(5):936–48. doi: 10.1016/j.eururo.2014.06.053. - DOI - PMC - PubMed
MeSH terms
Substances
Associated data
Grants and funding
LinkOut - more resources
Full Text Sources
Other Literature Sources
Medical
