

Remission of pre-diabetes to normal glucose tolerance in obese adults with high protein versus high carbohydrate diet: randomized control trial
- PMID: 27843552
- PMCID: PMC5093372
- DOI: 10.1136/bmjdrc-2016-000258
Remission of pre-diabetes to normal glucose tolerance in obese adults with high protein versus high carbohydrate diet: randomized control trial
Abstract
Objective: Remission of pre-diabetes to normal is an important health concern which has had little success in the past. This study objective was to determine the effect on remission of pre-diabetes with a high protein (HP) versus high carbohydrate (HC) diet and effects on metabolic parameters, lean and fat body mass in prediabetic, obese subjects after 6 months of dietary intervention.
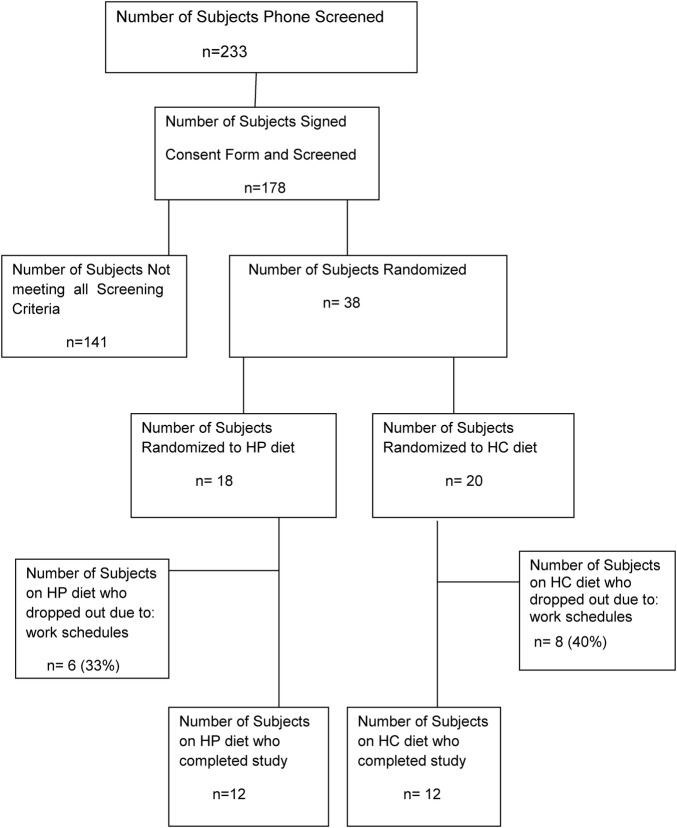
Research design and methods: We recruited and randomized 24 pre-diabetes women and men to either a HP (30% protein, 30% fat, 40% carbohydrate; n=12) or HC (15% protein, 30% fat, 55% carbohydrate; n=12) diet feeding study for 6 months in this randomized controlled trial. All meals were provided to subjects for 6 months with daily food menus for HP or HC compliance with weekly food pick-up and weight measurements. At baseline and after 6 months on the respective diets oral glucose tolerance and meal tolerance tests were performed with glucose and insulin measurements and dual energy X-ray absorptiometry scans.
Results: After 6 months on the HP diet, 100% of the subjects had remission of their pre-diabetes to normal glucose tolerance, whereas only 33.3% of subjects on the HC diet had remission of their pre-diabetes. The HP diet group exhibited significant improvement in (1) insulin sensitivity (p=0.001), (2) cardiovascular risk factors (p=0.04), (3) inflammatory cytokines (p=0.001), (4) oxidative stress (p=0.001), (5) increased percent lean body mass (p=0.001) compared with the HC diet at 6 months.
Conclusions: This is the first dietary intervention feeding study, to the best of our knowledge, to report 100% remission of pre-diabetes with a HP diet and significant improvement in metabolic parameters and anti-inflammatory effects compared with a HC diet at 6 months.
Trial registration number: NCT0164284.
Keywords: Cardiovascular Risk Factors; Dietary Intervention; Insulin Sensitivity; Pre-Diabetes.
Conflict of interest statement
Conflicts of Interest: None declared.
Figures
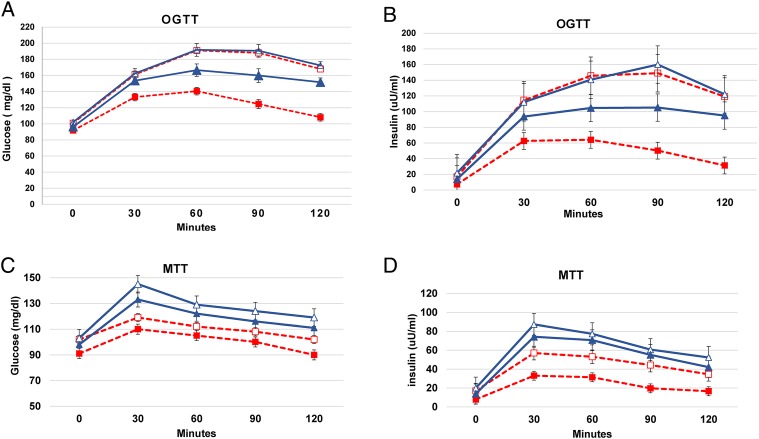
 HP diet baseline (HP_Bl);
  HP diet at 6 months (HP_6 m);
  HC diet baseline (HC_Bl); and
  HC diet at 6 months (HC_6 m). p Values for the glucose AUC for the OGTTs are: HP_Bl versus HP_6 m=0.0005; HC_Bl versus HC_6 m=0.005; HP_6 m versus HC_6 m=0.0001. p Values for the insulin AUC for the OGTTs are: HP_Bl versus HP_6 m=0.0001; HC_Bl versus HC_6 m=0.005; HP_6 m versus HC_6 m=0.0001. p values for the glucose AUC for the MTTs are: HP_Bl versus HP_6 m=0.0005; HC_Bl versus HC_6 m=0.005; HP_Bl versus HC_Bl=0.01; HP_6 m versus HC_6 m=0.0001. p values for the insulin AUC for the MTTs are: HP_Bl versus HP_6 m=0.001; HC_Bl versus HC_6 m=0.01; HP_Bl versus HC_Bl=0.001; HP_6 m versus HC_6 m=0.0001. AUC, area under the curve; HC, high carbohydrate; HP, high protein; OGTT, oral glucose tolerance test.
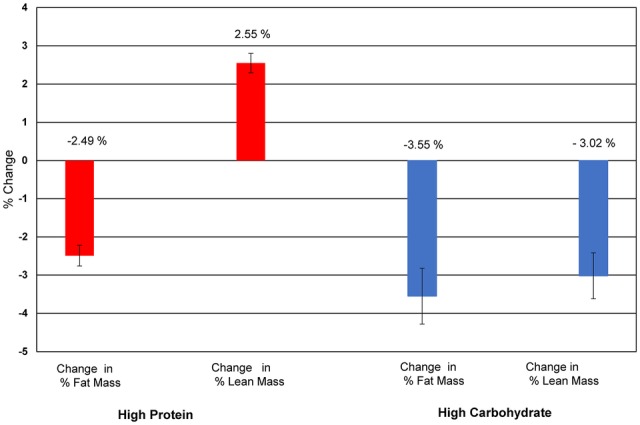
References
-
- (CDC) CfDC. National Diabetes Statistics Report 2014. http://wwwcdcgov/diabetes/data/statistics/2014StatisticsReport
-
- Albu J, Pi-Sunyer FX. Obesity and diabetes. In: Bray GA, Bouchard C, eds. Handbook of obesity. 2nd edn Marcel Dekker Inc., 2004:899–917.
Grants and funding
LinkOut - more resources
Full Text Sources
Other Literature Sources
Research Materials
Miscellaneous