. 2016 Aug 24;6(11):e00541.
doi: 10.1002/brb3.541. eCollection 2016 Nov.

A machine learning approach to identify functional biomarkers in human prefrontal cortex for individuals with traumatic brain injury using functional near-infrared spectroscopy

Affiliations

A machine learning approach to identify functional biomarkers in human prefrontal cortex for individuals with traumatic brain injury using functional near-infrared spectroscopy

Nader Karamzadeh et al. Brain Behav. .

Abstract

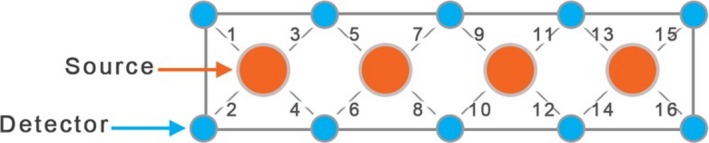
Background: We have explored the potential prefrontal hemodynamic biomarkers to characterize subjects with Traumatic Brain Injury (TBI) by employing the multivariate machine learning approach and introducing a novel task-related hemodynamic response detection followed by a heuristic search for optimum set of hemodynamic features. To achieve this goal, the hemodynamic response from a group of 31 healthy controls and 30 chronic TBI subjects were recorded as they performed a complexity task.

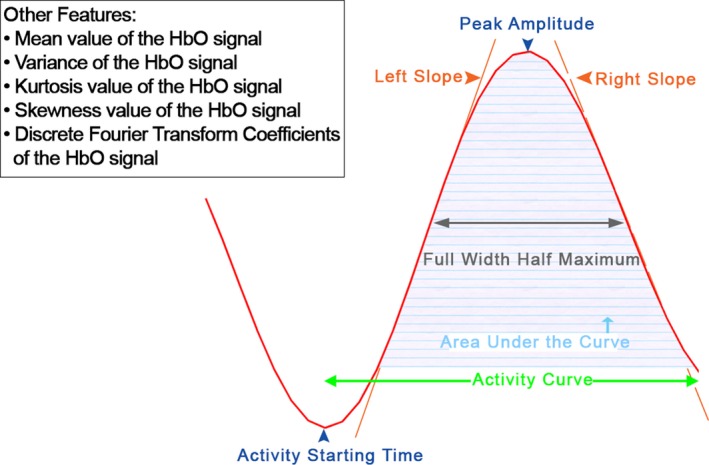
Methods: To determine the optimum hemodynamic features, we considered 11 features and their combinations in characterizing TBI subjects. We investigated the significance of the features by utilizing a machine learning classification algorithm to score all the possible combinations of features according to their predictive power.

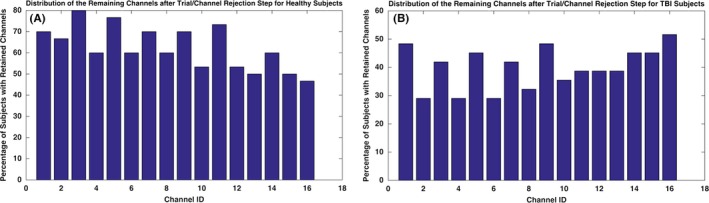
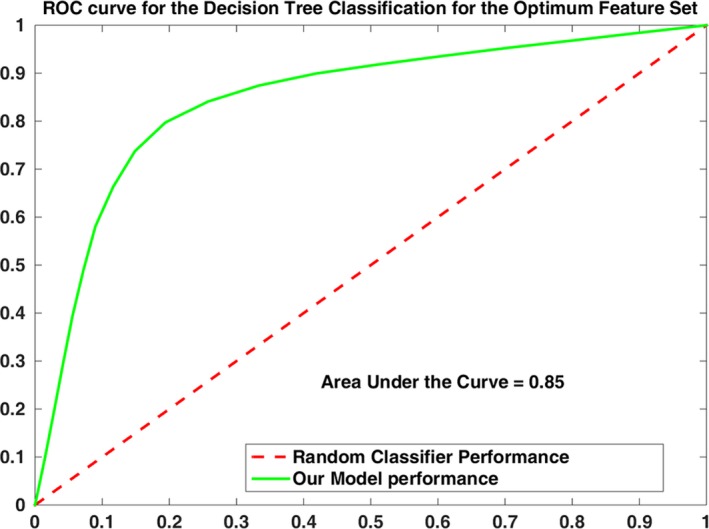
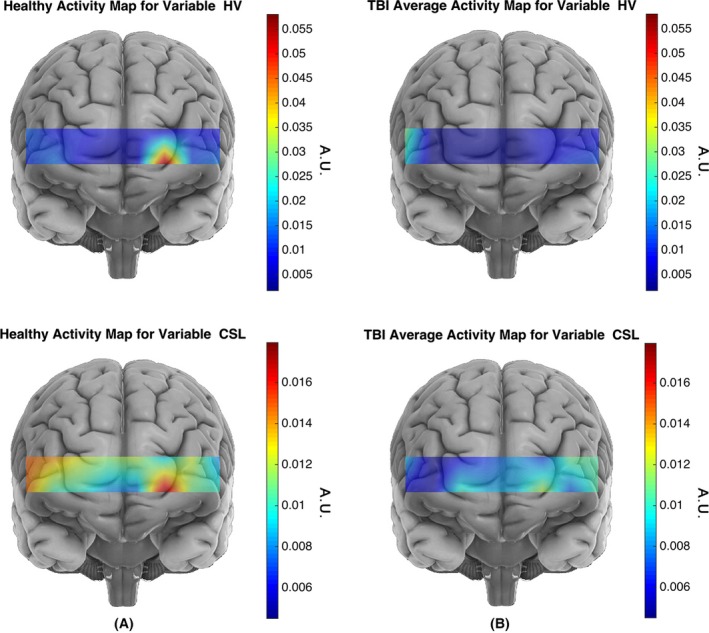
Results and conclusions: The identified optimum feature elements resulted in classification accuracy, sensitivity, and specificity of 85%, 85%, and 84%, respectively. Classification improvement was achieved for TBI subject classification through feature combination. It signified the major advantage of the multivariate analysis over the commonly used univariate analysis suggesting that the features that are individually irrelevant in characterizing the data may become relevant when used in combination. We also conducted a spatio-temporal classification to identify regions within the prefrontal cortex (PFC) that contribute in distinguishing between TBI and healthy subjects. As expected, Brodmann areas (BA) 10 within the PFC were isolated as the region that healthy subjects (unlike subjects with TBI), showed major hemodynamic activity in response to the High Complexity task. Overall, our results indicate that identified temporal and spatio-temporal features from PFC's hemodynamic activity are promising biomarkers in classifying subjects with TBI.

Keywords: classification; feature selection; machine learning; near‐infrared spectroscopy; time series feature extraction; traumatic brain injury; wrapper method.


Figures

Figure 1
Figure 1
Experimental paradigm for the functional near infrared spectroscopy (fNIRS) data collection. Every trial lasted 5 s and was separated by a randomly assigned jittered interstimulus interval of varied interval of 5–7 s
Figure 2
Figure 2
The functional near‐infrared spectroscopy (fNIRS) channel scheme. It is composed of 4 sources and 10 detectors, which form 16 source/detector pairs separated by 2.5 cm. The sensor pad is positioned on the subject's forehead
Figure 3
Figure 3
Visualizing the HbO signal (in red), activity curve and a number of hemodynamic features extracted in this study. The activity curve is a positive deflection representing the activation embodied in the HbO signal. The activity curve is formed by oxygenation's increase and its returns to same level of oxygenation
Figure 4
Figure 4
Channel distribution for the healthy and traumatic brain injury (TBI) populations after the channel/trial removal step is illustrated. For the TBI subjects, less number of subjects shares a common channel, whereas for majority of the healthy subjects share similar channels are kept. In the TBI population, more than half of the subjects share only channel 16. However, in healthy population except for channel 16, all the other channels are shared among more than half of the subjects
Figure 5
Figure 5
ROC curve for the classifying subjects into traumatic brain injury (TBI) and healthy groups, in the feature space constructed by the optimum feature set [CA, HDFT, CF]. Specificity and sensitivity values at each point of the graph are obtained by averaging the corresponding values across the 1000 run of the random subsampling procedure. Area under the curve of 0.85 is obtained for the constructed model, which signifies the high accuracy of the constructed classification model
Figure 6
Figure 6
The average activity maps for the CSL and HV features for the healthy (A) and traumatic brain injury (TBI) (B) subjects are illustrated. The activity map for a spatio‐temporal feature associated to a population is obtained by averaging every subjects' (from the corresponding population) spatio‐temporal feature set. For the traumatic brain injury (TBI) population, the larger HV values are located at multiple locations with largest on the right hemisphere, whereas for the healthy population the largest HV is concentrated on the left hemisphere of the Brodmann area 10 (BA 10). Furthermore, healthy subjects on average show larger HV values for the HbO signal that indicates oxygenation signal has shown higher variation in the healthy subjects. The HbO signal in response to the High Complexity task for the healthy subjects shows larger variation and is spatially less diffuse than for the TBI subjects. Considering the activity map for healthy subjects, largest CSL values cover the left frontopolar of the BA 10. A comparison of healthy and TBI subjects' CSL activity map reveals that healthy subjects have shown larger CSL values in response to the High complexity task at all the sites of functional near‐infrared spectroscopy (fNIRS) data collection

Similar articles

Cited by

References

    1. Ahmadlou, M. , Adeli, H. , & Adeli, A. (2010). New diagnostic EEG markers of the Alzheimer's disease using visibility graph. Journal of Neural Transmission, 117, 1099–1109. - PubMed
    1. Amyot, F. , Zimmermann, T. , Riley, J. , Kainerstorfer, J. M. , Chernomordik, V. , Mooshagian, E. , … Wassermann, E. M. (2012). Normative database of judgment of complexity task with functional near infrared spectroscopy–application for TBI. NeuroImage, 60, 879–883. - PMC - PubMed
    1. Anderson, A. A. , Smith, E. , Chernomordik, V. , Ardeshirpour, Y. , Chowdhry, F. , Thurm, A. , … Gandjbakhche, A. H. (2014). Prefrontal cortex hemodynamics and age: A pilot study using functional near infrared spectroscopy in children. Frontiers in Neuroscience, 8, 393. - PMC - PubMed
    1. Bhambhani, Y. , Maikala, R. , Farag, M. , & Rowland, G. (2006). Reliability of near‐infrared spectroscopy measures of cerebral oxygenation and blood volume during handgrip exercise in nondisabled and traumatic brain‐injured subjects. Journal of Rehabilitation Research and Development, 43, 845. - PubMed
    1. Bishop, C. M. (2006) Pattern recognition and machine learning. New York, NY: Springer‐Verlag.

Publication types