. 2016 Nov 3;3(5):ENEURO.0093-16.2016.
doi: 10.1523/ENEURO.0093-16.2016. eCollection 2016 Sep-Oct.

A Bayesian Account of Visual-Vestibular Interactions in the Rod-and-Frame Task

Affiliations

A Bayesian Account of Visual-Vestibular Interactions in the Rod-and-Frame Task

Bart B G T Alberts et al. eNeuro. .

Abstract

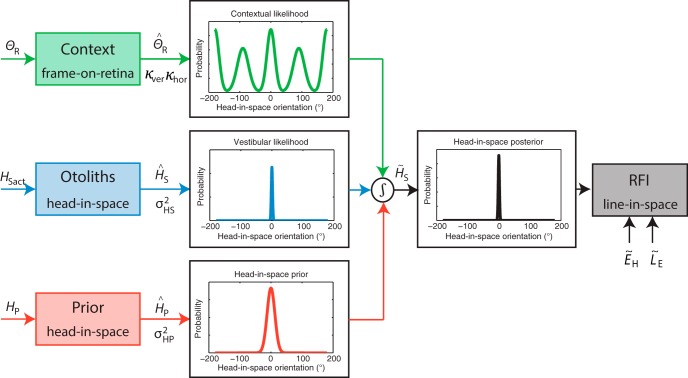
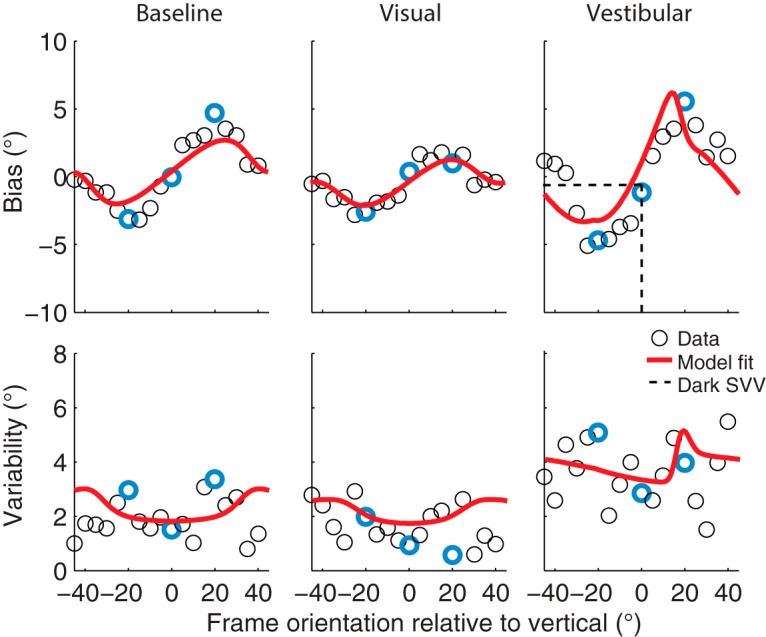
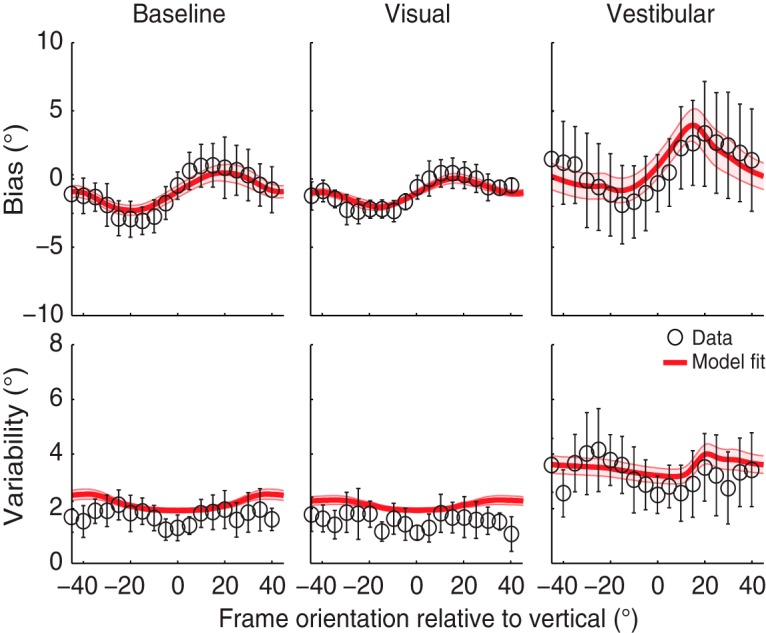
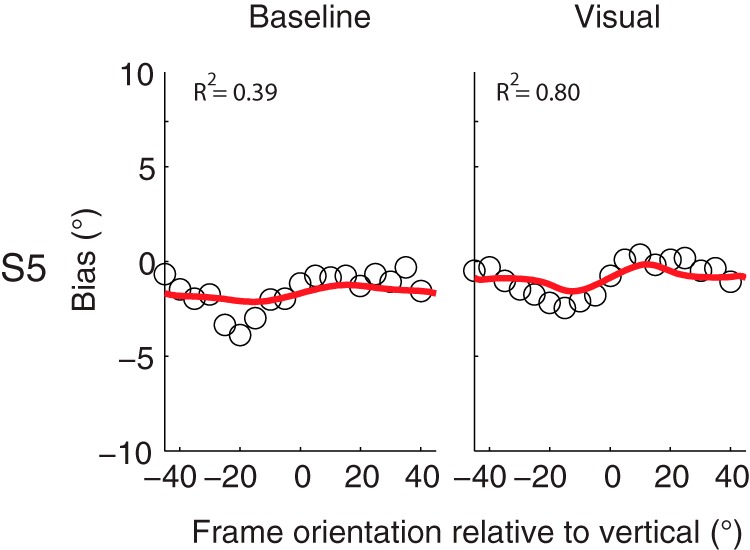
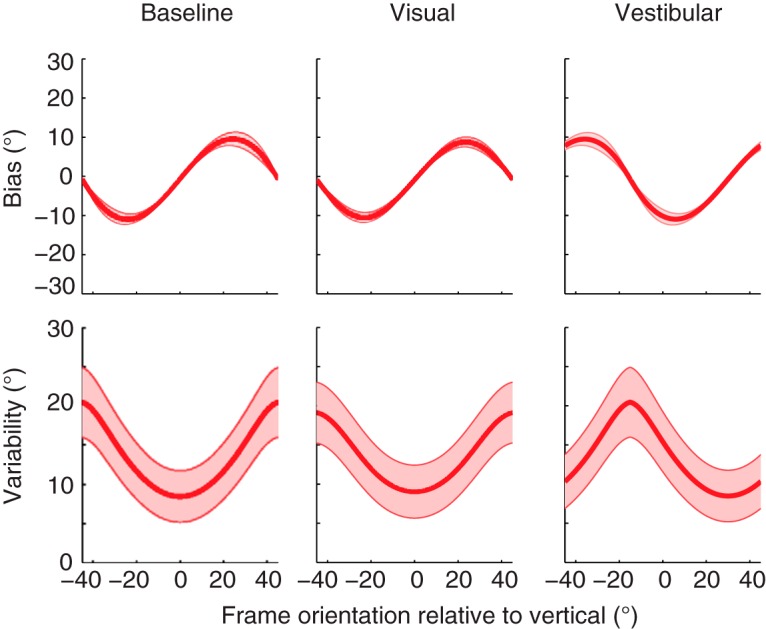
Panoramic visual cues, as generated by the objects in the environment, provide the brain with important information about gravity direction. To derive an optimal, i.e., Bayesian, estimate of gravity direction, the brain must combine panoramic information with gravity information detected by the vestibular system. Here, we examined the individual sensory contributions to this estimate psychometrically. We asked human subjects to judge the orientation (clockwise or counterclockwise relative to gravity) of a briefly flashed luminous rod, presented within an oriented square frame (rod-in-frame). Vestibular contributions were manipulated by tilting the subject's head, whereas visual contributions were manipulated by changing the viewing distance of the rod and frame. Results show a cyclical modulation of the frame-induced bias in perceived verticality across a 90° range of frame orientations. The magnitude of this bias decreased significantly with larger viewing distance, as if visual reliability was reduced. Biases increased significantly when the head was tilted, as if vestibular reliability was reduced. A Bayesian optimal integration model, with distinct vertical and horizontal panoramic weights, a gain factor to allow for visual reliability changes, and ocular counterroll in response to head tilt, provided a good fit to the data. We conclude that subjects flexibly weigh visual panoramic and vestibular information based on their orientation-dependent reliability, resulting in the observed verticality biases and the associated response variabilities.

Keywords: Bayesian inference; internal models; multisensory integration; rod-and-frame task; spatial orientation; verticality perception.


Conflict of interest statement

Authors report no conflict of interest.

Figures

Figure 1.
Figure 1.
Experimental procedure of the rod-and-frame task. After presenting a square frame for 250 ms, a rod is briefly (33 ms) flashed within the frame. When the rod disappears, the square remains visible until the subjects responds whether the rod was rotated CW or CCW from upright. A 500-ms black screen is presented before the start of a new trial.
Figure 2.
Figure 2.
Schematic representation of the refined Bayesian optimal integration model for visual context. Physical signals about the retinal frame orientation (θR), true head-in-space orientation (HSact), and prior knowledge about likely head orientations (HP) are transformed into sensory signals, denoted by the hat symbol (ˆ). Sensory signals are assumed to be accurate but contaminated with Gaussian noise (κ, σHS, and σHP, respectively). For an optimal estimate of head-in-space orientation, denoted by a tilde (˜), the model integrates the contextual likelihood P(θ^R|HS) together with the vestibular likelihood P(H^S|HS) and the head-in-space prior P(HS) This translates into multiplying the individual probability distributions: P(H˜S|H^S,θ^R)=P(H^S|HS)P(θ^R|HS)P(HS) The maximum of the resulting posterior distribution (MAP) is selected as the perceived head-in-space orientation (H˜S), whereas the width of the curve is a measure of the response variability. The perceived orientation of the line in space is then obtained by a coordinate transformation using the eye-in-head orientation (E˜H, uncompensated ocular counterroll) and the retinal rod orientation estimate (L˜E , assumed to be veridical). The probability distributions in the figure represent the case in which the subject is seated upright (HS = 0°) with the frame displayed upright (θR = 0°).
Figure 3.
Figure 3.
Probability of CW responses plotted against rod orientation for three example frame orientations (20° CCW, upright, and 20°CW) in a representative subject (black circles). Red solid lines represent the psychometric fits that quantify the bias (µ, dashed line) and variability (σ, inversely related to the slope) of the subject in each panel.
Figure 4.
Figure 4.
Bias and response variability plotted against frame orientation in a representative subject (circles) for all conditions. The biases and variabilities obtained from Figure 3 are highlighted in blue. Red solid lines represent the best fit of the Bayesian optimal integration model (Table 2). The dashed lines in the vestibular bias plot indicate the dark subjective visual vertical task (SVV).
Figure 5.
Figure 5.
Mean bias and variability plots across all subjects for all conditions. Error bars represent the SD across subjects. The red solid lines on top of the data are the mean of the best fit across all subjects, with the shaded areas representing the SE on the model fit.
Figure 6.
Figure 6.
Prior (red), otoliths (blue), and visual contextual (green) weight distributions plotted against frame orientation in the different conditions. Shaded areas represent the SE across all subjects.
Figure 7.
Figure 7.
Bias plotted against frame orientation in the baseline and visual condition for subject S5. Red solid lines indicate the best fit of the Bayesian optimal integration model. R 2 values indicate the goodness of fit of the model to the data.
Figure 8.
Figure 8.
Simulations of the Bayesian optimal integration model for bias and response variability in patients with complete vestibular function loss. Shaded areas represent the SE on the model simulations.

References

    1. Alberts BBGT, Selen LPJ, Bertolini G, Straumann D, Medendorp WP, Tarnutzer AA (2016) Dissociating vestibular and somatosensory contributions to spatial orientation. J Neurophysiol jn.00056.2016. - PMC - PubMed
    1. Angelaki DE, Cullen KE (2008) Vestibular system: the many facets of a multimodal sense. Annu Rev Neurosci 31:125–150. 10.1146/annurev.neuro.31.060407.125555 - DOI - PubMed
    1. Antonucci G, Fanzon D (1995) Visual factors affecting the rod-and-frame illusion: role of gap size and frame components. Perception 24:1119–1130. - PubMed
    1. Asch S, Witkin H (1948) Studies in space orientation. II. Perception of the upright with displaced visual fields and with body tilted. J Exp Psychol 38:603–614. 10.1037/h0054121 - DOI - PubMed
    1. Aubert H (1861) Eine scheinbare bedeutende Drehung von Objecten bei Neigung des Kopfes nach rechts oder links. Arch Für Pathol Anat Und Physiol Und Für Klin Med 20:381–393. 10.1007/BF02355256 - DOI

Publication types

LinkOut - more resources