

Microcalcification Segmentation from Mammograms: A Morphological Approach
- PMID: 27844218
- PMCID: PMC5359208
- DOI: 10.1007/s10278-016-9923-8
Microcalcification Segmentation from Mammograms: A Morphological Approach
Abstract
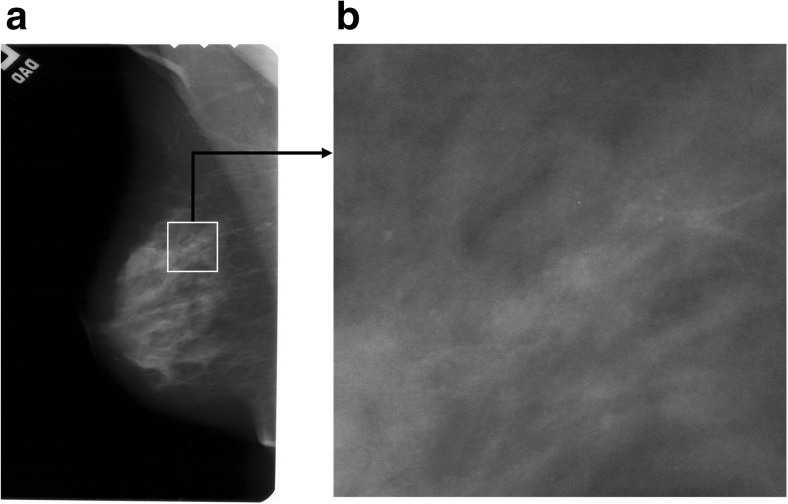
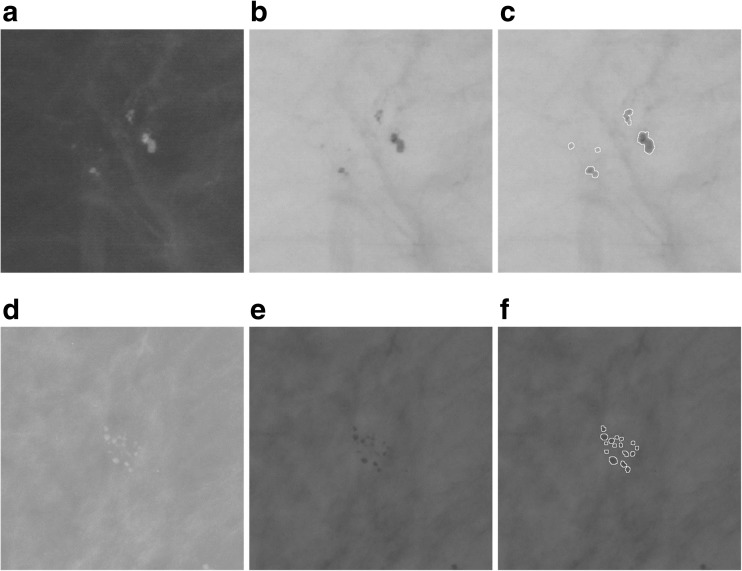
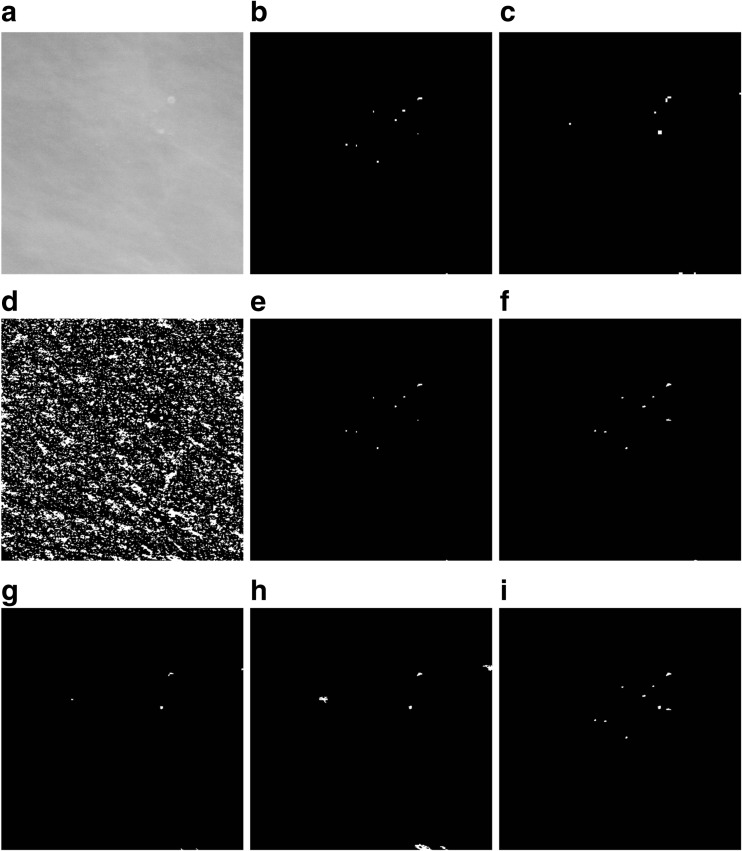
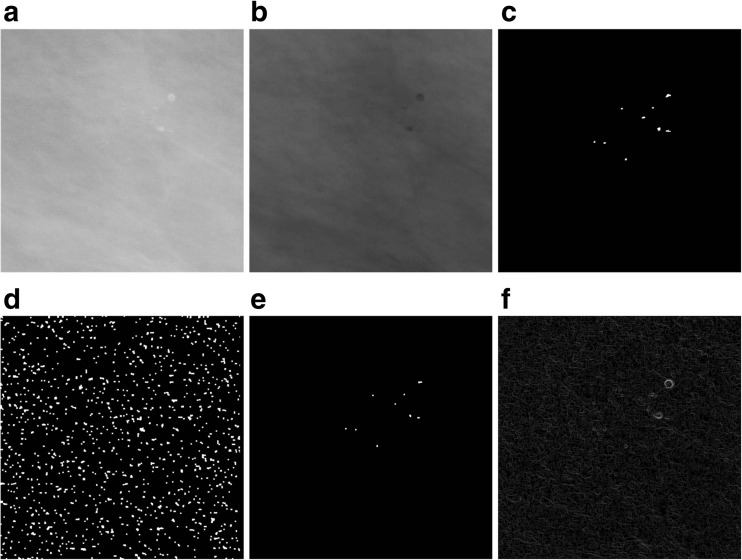
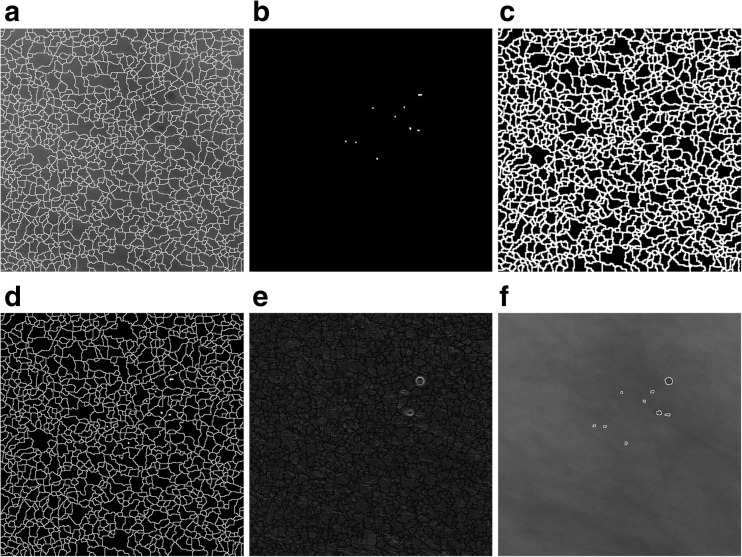
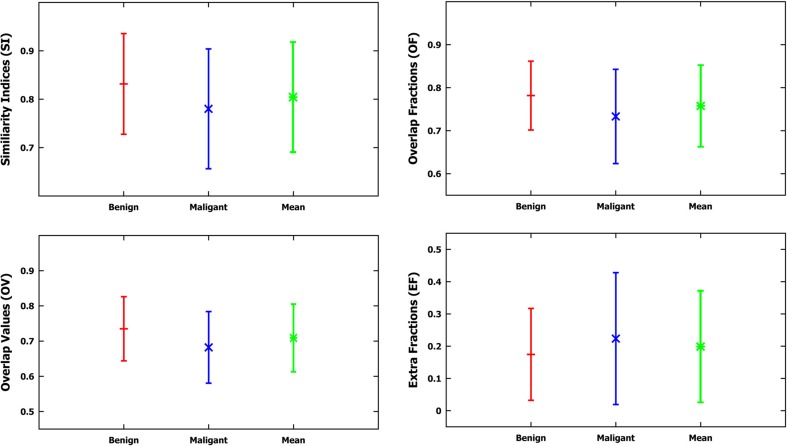
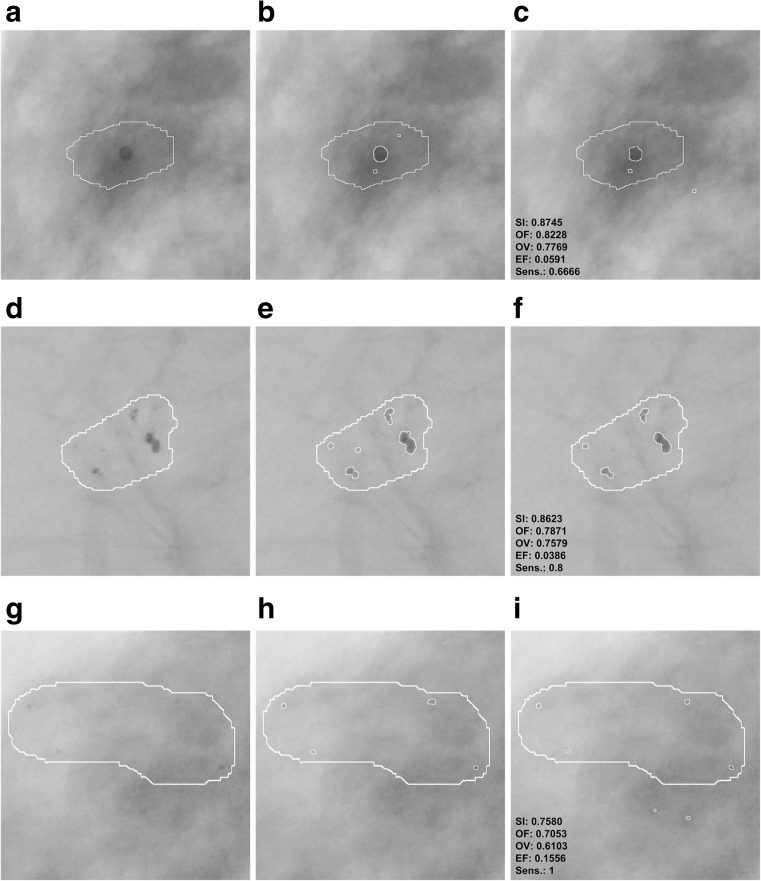
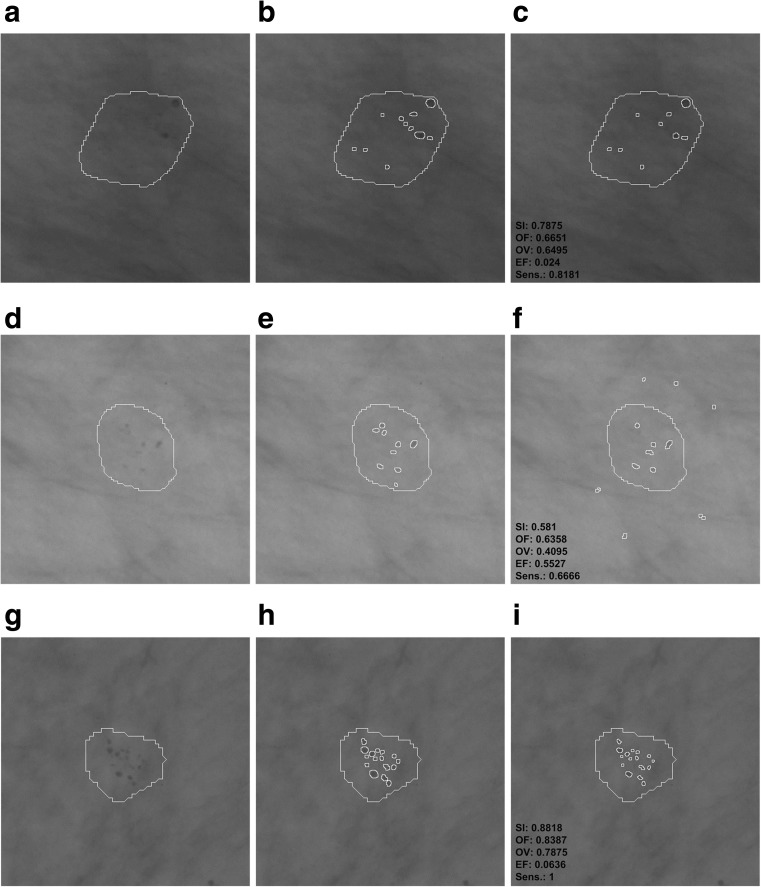
This publication presents a computer method for segmenting microcalcifications in mammograms. It makes use of morphological transformations and is composed of two parts. The first part detects microcalcifications morphologically, thus allowing the approximate area of their occurrence to be determined, the contrast to be improved, and noise to be reduced in the mammograms. In the second part, a watershed segmentation of microcalcifications is carried out. This study was carried out on a test set containing 200 ROIs 512 × 512 pixels in size, taken from mammograms from the Digital Database for Screening Mammography (DDSM), including 100 cases showing malignant lesions and 100 cases showing benign ones. The experiments carried out yielded the following average values of the measured indices: 80.5% (similarity index), 75.7% (overlap fraction), 70.8% (overlap value), and 19.8% (extra fraction). The average time of executing all steps of the methods used for a single ROI amounted to 0.83 s.
Keywords: Breast cancer; Image processing; Mammography; Mathematical morphology; Microcalcification; Segmentation.
Figures
Similar articles
-
A fractal approach to the segmentation of microcalcifications in digital mammograms.Med Phys. 1995 Apr;22(4):381-90. doi: 10.1118/1.597473. Med Phys. 1995. PMID: 7609718
-
Segmentation and numerical analysis of microcalcifications on mammograms using mathematical morphology.Br J Radiol. 1997 Sep;70(837):903-17. doi: 10.1259/bjr.70.837.9486066. Br J Radiol. 1997. PMID: 9486066
-
Evaluating geodesic active contours in microcalcifications segmentation on mammograms.Comput Methods Programs Biomed. 2015 Dec;122(3):304-15. doi: 10.1016/j.cmpb.2015.08.016. Epub 2015 Aug 29. Comput Methods Programs Biomed. 2015. PMID: 26363676
-
[Digital magnification mammography. A new technique for improved visualization of microcalcifications in breast cancer diagnosis].Radiologe. 1993 May;33(5):260-6. Radiologe. 1993. PMID: 8516436 Review. German.
-
Practical importance of breast microcalcifications: report on 112 cases.Eur J Surg Oncol. 1988 Dec;14(6):651-61. Eur J Surg Oncol. 1988. PMID: 3056750 Review.
Cited by
-
Breast Cancer Segmentation Methods: Current Status and Future Potentials.Biomed Res Int. 2021 Jul 20;2021:9962109. doi: 10.1155/2021/9962109. eCollection 2021. Biomed Res Int. 2021. PMID: 34337066 Free PMC article. Review.
-
Pattern Recognition and Size Prediction of Microcalcification Based on Physical Characteristics by Using Digital Mammogram Images.J Digit Imaging. 2018 Dec;31(6):912-922. doi: 10.1007/s10278-018-0075-x. J Digit Imaging. 2018. PMID: 29873011 Free PMC article.
-
Automated quantitative assessment of amorphous calcifications: Towards improved malignancy risk stratification.Comput Biol Med. 2022 Jul;146:105504. doi: 10.1016/j.compbiomed.2022.105504. Epub 2022 Apr 8. Comput Biol Med. 2022. PMID: 35525068 Free PMC article.
-
Improving the Quantitative Analysis of Breast Microcalcifications: A Multiscale Approach.J Digit Imaging. 2023 Jun;36(3):1016-1028. doi: 10.1007/s10278-022-00751-3. Epub 2023 Feb 23. J Digit Imaging. 2023. PMID: 36820930 Free PMC article.
-
Breast Mass Detection in Mammography Based on Image Template Matching and CNN.Sensors (Basel). 2021 Apr 18;21(8):2855. doi: 10.3390/s21082855. Sensors (Basel). 2021. PMID: 33919623 Free PMC article.
References
MeSH terms
LinkOut - more resources
Full Text Sources
Other Literature Sources
Medical
