

Mutation tendency of mutator Plasmodium berghei with proofreading-deficient DNA polymerase δ
- PMID: 27845384
- PMCID: PMC5109483
- DOI: 10.1038/srep36971
Mutation tendency of mutator Plasmodium berghei with proofreading-deficient DNA polymerase δ
Abstract
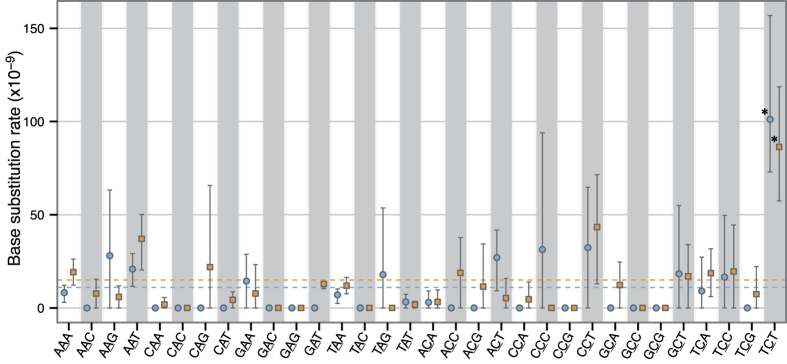
In this study, we investigated the mutation tendency of a mutator rodent malaria parasite, Plasmodium berghei, with proofreading-deficient DNA polymerase δ. Wild-type and mutator parasites were maintained in mice for over 24 weeks, and the genome-wide accumulated mutations were determined by high-throughput sequencing. The mutator P. berghei had a significant preference for C/G to A/T substitutions; thus, its genome had a trend towards a higher AT content. The mutation rate was influenced by the sequence context, and mutations were markedly elevated at TCT. Some genes mutated repeatedly in replicate passage lines. In particular, knockout mutations of the AP2-G gene were frequent, which conferred strong growth advantages on parasites during the blood stage but at the cost of losing the ability to form gametocytes. This is the first report to demonstrate a biased mutation tendency in malaria parasites, and its results help to promote our basic understanding of Plasmodium genetics.
Figures


Similar articles
-
Isolation of Mutants With Reduced Susceptibility to Piperaquine From a Mutator of the Rodent Malaria Parasite Plasmodium berghei.Front Cell Infect Microbiol. 2021 Jun 16;11:672691. doi: 10.3389/fcimb.2021.672691. eCollection 2021. Front Cell Infect Microbiol. 2021. PMID: 34222045 Free PMC article.
-
Generation of rodent malaria parasites with a high mutation rate by destructing proofreading activity of DNA polymerase δ.DNA Res. 2014 Aug;21(4):439-46. doi: 10.1093/dnares/dsu009. Epub 2014 Mar 25. DNA Res. 2014. PMID: 24670267 Free PMC article.
-
Comparative genomics and proteomic analyses between lethal and nonlethal strains of Plasmodium berghei.Exp Parasitol. 2018 Feb;185:1-9. doi: 10.1016/j.exppara.2018.01.001. Epub 2018 Jan 4. Exp Parasitol. 2018. PMID: 29307564
-
Genome-Wide Identification of the Target Genes of AP2-O, a Plasmodium AP2-Family Transcription Factor.PLoS Pathog. 2015 May 27;11(5):e1004905. doi: 10.1371/journal.ppat.1004905. eCollection 2015 May. PLoS Pathog. 2015. PMID: 26018192 Free PMC article.
-
Towards genome-wide experimental genetics in the in vivo malaria model parasite Plasmodium berghei.Pathog Glob Health. 2015 Mar;109(2):46-60. doi: 10.1179/2047773215Y.0000000006. Epub 2015 Mar 19. Pathog Glob Health. 2015. PMID: 25789828 Free PMC article. Review.
Cited by
-
Deletion of the chloroquine resistance transporter gene confers reduced piperaquine susceptibility to the rodent malaria parasite Plasmodium berghei.Antimicrob Agents Chemother. 2025 Apr 2;69(4):e0158924. doi: 10.1128/aac.01589-24. Epub 2025 Feb 24. Antimicrob Agents Chemother. 2025. PMID: 39992104 Free PMC article.
-
Analysis of genome instability and implications for the consequent phenotype in Plasmodium falciparum containing mutated MSH2-1 (P513T).Microb Genom. 2023 Apr;9(4):mgen001003. doi: 10.1099/mgen.0.001003. Microb Genom. 2023. PMID: 37083479 Free PMC article.
-
Proteome size reduction in Apicomplexans is linked with loss of DNA repair and host redundant pathways.Infect Genet Evol. 2021 Jan;87:104642. doi: 10.1016/j.meegid.2020.104642. Epub 2020 Dec 6. Infect Genet Evol. 2021. PMID: 33296723 Free PMC article.
-
ApiAP2 Transcription Factors in Apicomplexan Parasites.Pathogens. 2019 Apr 7;8(2):47. doi: 10.3390/pathogens8020047. Pathogens. 2019. PMID: 30959972 Free PMC article. Review.
-
Isolation of Mutants With Reduced Susceptibility to Piperaquine From a Mutator of the Rodent Malaria Parasite Plasmodium berghei.Front Cell Infect Microbiol. 2021 Jun 16;11:672691. doi: 10.3389/fcimb.2021.672691. eCollection 2021. Front Cell Infect Microbiol. 2021. PMID: 34222045 Free PMC article.
References
-
- World Health Organization. World Malaria Report 2014 (2015).
Publication types
MeSH terms
Substances
LinkOut - more resources
Full Text Sources
Other Literature Sources
Research Materials
