. 2016 Nov 15:6:37011.
doi: 10.1038/srep37011.

Hypometabolism during Daily Torpor in Mice is Dominated by Reduction in the Sensitivity of the Thermoregulatory System

Affiliations

Hypometabolism during Daily Torpor in Mice is Dominated by Reduction in the Sensitivity of the Thermoregulatory System

Genshiro A Sunagawa et al. Sci Rep. .

Abstract

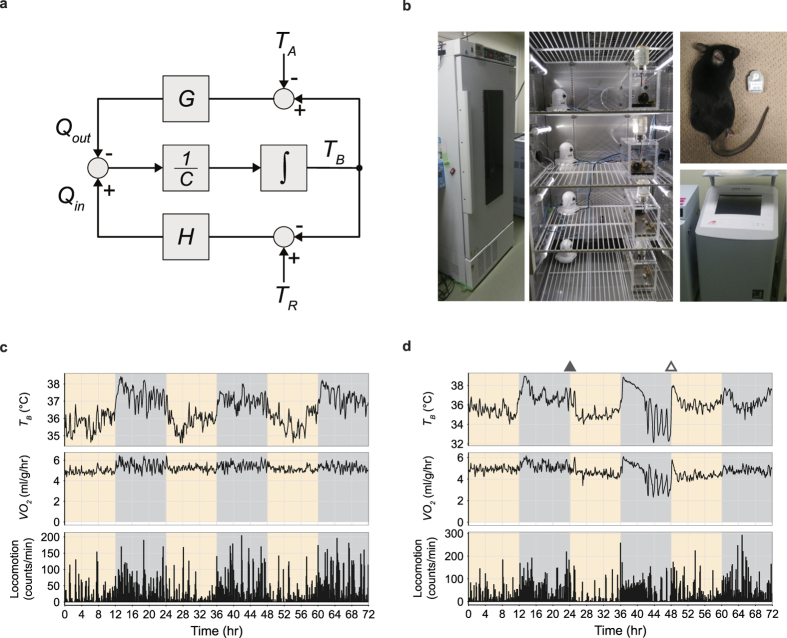
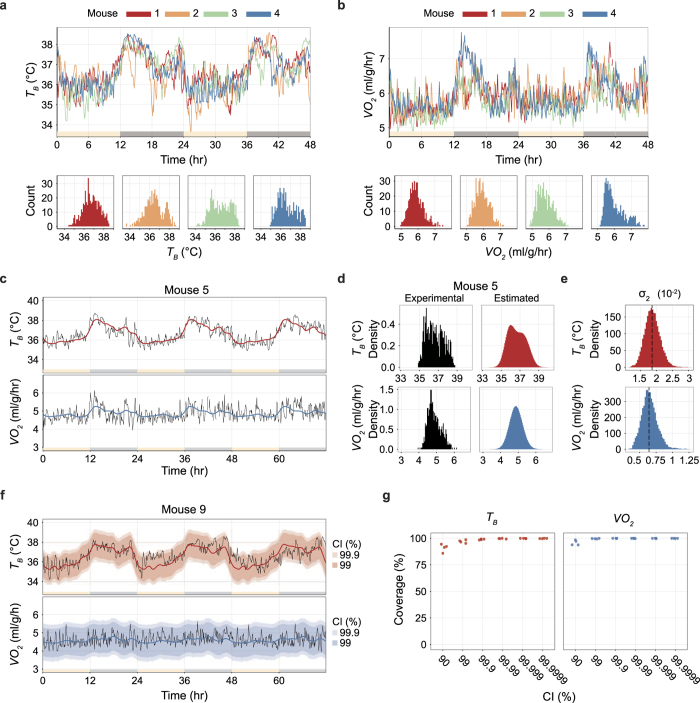
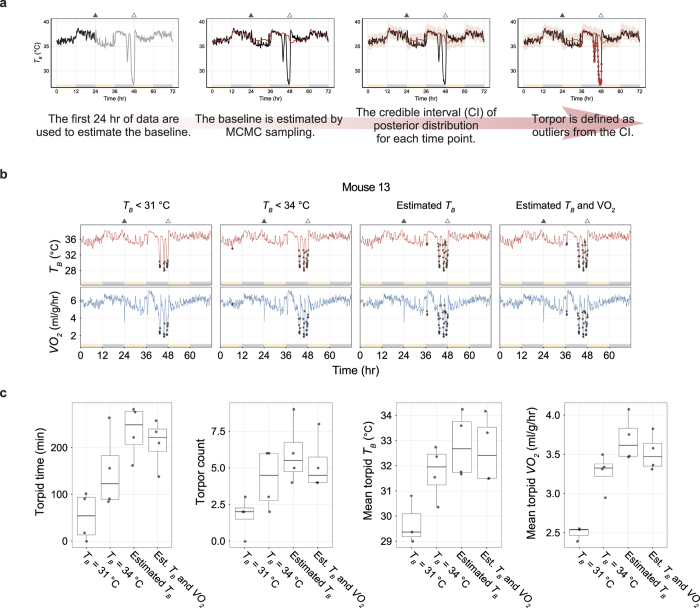
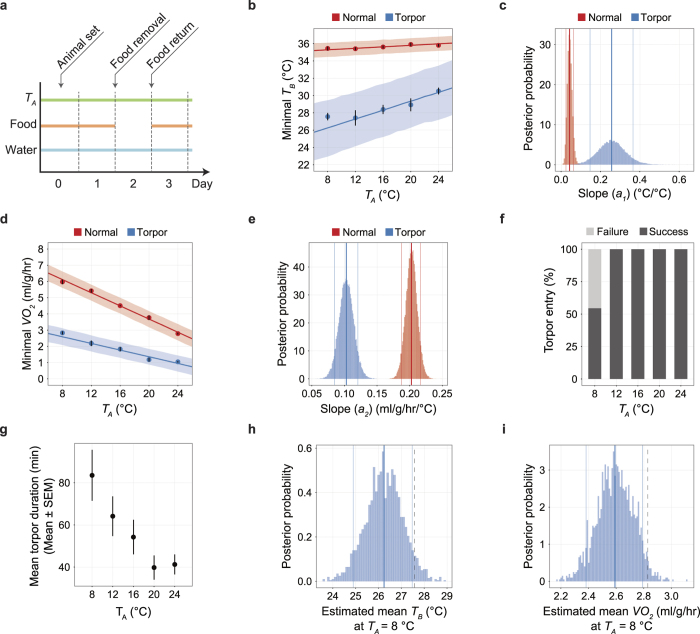
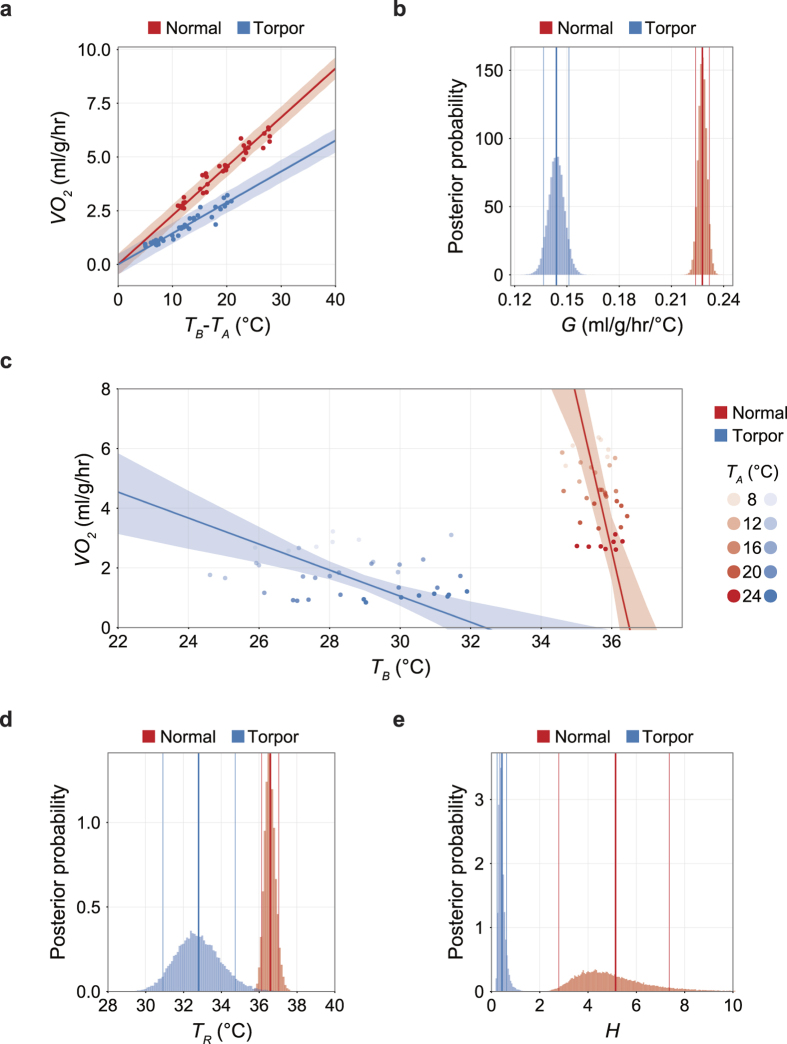
Some mammals enter a hypometabolic state either daily torpor (minutes to hours in length) or hibernation (days to weeks), when reducing metabolism would benefit survival. Hibernators demonstrate deep torpor by reducing both the sensitivity (H) and the theoretical set-point temperature (TR) of the thermogenesis system, resulting in extreme hypothermia close to ambient temperature. However, these properties during daily torpor remain poorly understood due to the very short steady state of the hypometabolism and the large variation among species and individuals. To overcome these difficulties in observing and evaluating daily torpor, we developed a novel torpor-detection algorithm based on Bayesian estimation of the basal metabolism of individual mice. Applying this robust method, we evaluated fasting induced torpor in various ambient temperatures (TAs) and found that H decreased 91.5% during daily torpor while TR only decreased 3.79 °C in mice. These results indicate that thermogenesis during daily torpor shares a common property of sensitivity reduction with hibernation while it is distinct from hibernation by not lowering TR. Moreover, our findings support that mice are suitable model animals to investigate the regulation of the heat production during active hypometabolism, thus suggesting further study of mice may provide clues to regulating hypometabolism in mammals.


Figures

Figure 1
Figure 1. System for recording the metabolism of free-moving mice under controlled ambient temperature.
(a) A block diagram of the thermoregulatory system in mammals when the animal is not moving, therefore assumed to exert no external work. The upper loop and the lower loop represent the heat loss and heat production loop, respectively. The time derivative of body temperature (TB) is derived from the difference of heat production (Qin) and heat loss (Qout) divided by the thermal capacity (C). Qout is derived from the difference of ambient temperature (TA) and TB multiplied by heat conductance (G). Qin is derived from the difference of theoretically defined set-point temperature (TR) and TBmultiplied by H, which is the open-loop gain of the thermoregulatory feedback system. (b) A system for evaluating the metabolism of free-moving mice. The temperature-controlled animal chamber (left panel) and the inside of the chamber (middle panel), in which four mice can be recorded at once, are shown. Each animal had an intraperitoneally implanted body-temperature transmitter (right panel, top). Each animal was housed in a metabolic chamber and the VO2 were recorded by gas mass spectrometry. (c) A representative recording of mouse metabolism for three consecutive days. The animal was placed in the chamber, and the TA was maintained at 16 °C. Once the mouse was placed in the metabolic chamber, there was no physical contact with researchers during the recording period. Note the clear circadian rhythm seen in the TB, VO2 and locomotion. Yellow shading shows the light-on period. (d) A representative recording of metabolism during fasting-induced daily torpor. The mouse was placed in the chamber for three days; food was removed on the second day (filled triangle). The TA was maintained at 16 °C. Daily torpor started during the latter half of the second day. The mouse returned to a euthermic state immediately after the food was returned to the chamber (unfilled triangle). Yellow shading shows the light-on period.
Figure 2
Figure 2. Modelling and predicting metabolism from a single day recording.
(a,b) The distribution of the TB (a) and VO2 (b) of four animals (mice 1 to 4) kept at a TA of 12 °C for two days. The upper panels show the time series; light and dark periods are indicated by yellow and grey bars along the horizontal axis. The distribution for each animal is shown in the lower panels; each colour represents a different animal. (c) The estimated baseline metabolism dynamics of mouse 5. The mouse was kept at a TA of 16 °C for three days. The baseline dynamics for 24 hours were fitted from the three-day-length data, and the standard deviation of the error (σ2) for both TB and VO2 was estimated. The red and blue lines denote the median of the posterior distribution of the estimated TB and VO2, respectively. The data for the remaining three animals (mice 6 to 8) are available in Supplementary Fig. 2a. (d) The probability density of the experimentally obtained and estimated data for TB and VO2 for mouse 5. Black histograms represent experimental data; red and blue histograms show the estimated probability density. The data for mice 6 to 8 are available in Supplementary Fig. 2b. (e) The distribution of the estimated σ2, which is the standard deviation of the error of the secondary trend, for TB and VO2. (f) The estimated baseline metabolism dynamics of mouse 9 with credible intervals (CIs). The TA was kept at 16 °C for three days. The first 24 hours were used for estimation. The red and blue lines denote the median of the posterior distribution of the estimated TB and VO2. The red and blue shaded areas denote the CI. The data for mice 10 to12 are available in Supplementary Fig. 2c. (g) CI coverage rate of the metabolism on the second and third days when applying different CI ratios. The estimation was based on the first day. For both TB and VO2, 99.9% of the CIs covered more than 99% of the sampling points of the latter two days.
Figure 3
Figure 3. Defining daily torpor as an outlying low metabolism.
(a) The daily torpor-detection pipeline. The first 24-hour data set is used to estimate the baseline metabolism of the individual animal (first panel). The estimated baseline is then applied to the rest of the recordings (second panel). The baseline estimation provides the CI for the prediction from the distribution of the posterior estimates (third panel). Torpor, which is defined as a lower outlier from the CI, is marked in red dots (fourth panel). The filled and unfilled triangles denote food removal and return, respectively. (b) Multiple torpor definitions were compared in four mice (mice 13 to 16). The animals were placed in a constant TA of 12 °C for three days, and food was restricted during the second day. Results are shown for mouse 13. The two leftmost panels show daily torpor defined by a fixed threshold TB of 31 °C or 34 °C. The third panel shows daily torpor defined by a lower outlier of the 99.9% CI of the estimated TB. The fourth panel includes the TB-based definition further narrowed down by adding the condition of lower outliers from the 99.9% CI of the estimated VO2. The filled and unfilled triangles denote food removal and return, respectively. The data for the remaining three animals are available in Supplementary Fig. 3a. (c) Boxplots for various torpor statistics according to the different torpor definitions listed in Fig. 3b. The band inside the box, the bottom of the box, and the top of the box represent the median, the first quartile, and the third quartile, respectively. The end of the upper whisker is the highest value that is within 1.5 times the inter-quartile range (IQR). The end of the lower whisker is the lowest value that is within 1.5 times the IQR. All data points are shown as grey dots.
Figure 4
Figure 4. Body-temperature homeostasis is actively controlled during daily torpor.
(a) Protocol of the fasting-induced daily torpor experiment. Animals were placed in the TA-constant chamber on Day 0; data were recorded for 72 hours from the beginning of Day 1. Food was removed and returned at the beginning of Day 2 and Day 3. Water was freely accessible throughout the experiment. (b) The minimum TB at various TAs. Including the following panels, red and blue denote normal and torpid status, respectively. For normal status, the minimum TB of the dark phase of Day 1 was used for analysis. For torpid status, the minimum TB during torpor was used for analysis. As in the following panel d, the dots with the vertical error bars denote the observed mean and SEM of the minimum variables (TB in b, VO2 in d) at each TA, and the line and the shaded area denote the mean and the 89% HPDI intervals of the estimated minimum variables. (c) The posterior distribution of the slope (a1) of TATB relationship. Including the following distribution panels in this figure, the bold and thin lines denote the mean and the 89% HPDI intervals of the estimated values. The bin size is 0.005. (d) The minimum VO2 at various TAs. Minimum VO2 was defined as the VO2 recorded when the TB was minimum. (e) The posterior distribution of the slope (a2) of TA-VO2 relationship. The bin size is 0.001 ml/g/hr/°C. (f) The rate of successful daily torpor induction at various TAs. When TA was above 12 °C, all animals entered daily torpor. (g) The averaged torpor duration for each episode. One torpor episode is tended to be shorter when the TA gets higher. (h, i) The posterior distribution of the estimated mean (n = 6) of TB (h) and VO2 (i) at a TA of 8 °C. Because the observed mean (dashed lines) is larger than the 89% HPDI in both TB and VO2, when TA = 8 °C, the animal exhibited higher metabolism than expected. The bin size is 0.1 °C and 0.01 ml/g/hr for TB and VO2, respectively.
Figure 5
Figure 5. The sensitivity of the heat production system is largely reduced during daily torpor while the reduction of set-point temperature was small.
(a) The relationship between the difference of TB from TA and VO2. Including the following panels, red and blue denote normal and torpid status, respectively. The slope of this relationship is the heat conductance, G. As in panel c, the dots represent the observed values, and the lines and shaded areas represent the means and the 89% HPDI intervals of the estimated values. (b) The posterior distribution of the estimated G. During torpor, G is smaller than during normal states. Decrease in G results in heat preservation. However, the TB decrease seen in daily torpor is indicating the decrease in G is overridden or induced by decrease of heat production. The bin size is 0.001 ml/g/hr/°C. As in panel d and e, the bold and thin lines denote the mean and the 89% HPDI intervals of the estimated values. (c) The relationship between minimum TB and VO2 seen during normal and torpid states among various TAs. The brightness of the dots is indicating the TA. The horizontal intercept of the line indicates the theoretical set-point of TB, which is TR (See Fig. 1a). During normal states, TB is kept relatively constant by employing oxygen and producing heat to fill the gap between TR and TA. On the other hand, during daily torpor, the sensitivity against TR - TB is weakened which is visualized by less steep slope, which is H, the open-loop negative feedback gain of the heat production loop (See Fig. 1a). (d) The posterior distribution of the estimated TR. During daily torpor, TR became smaller than normal states, although the mean difference was 3.79 °C. The bin size is 0.1 °C. (e) The posterior distribution of the estimated H. During daily torpor, H became dramatically smaller than normal states, which the mean difference reached to 4.70 ml/g/hr/°C. This is clearly showing that the open-loop gain of the heat production system reduced to 8.5% during daily torpor from the normal state. The bin size is 0.05 ml/g/hr/°C.

References

    1. Geiser F. Hibernation. Curr. Biol. 23, R188–R193 (2013). - PubMed
    1. Heldmaier G., Ortmann S. & Elvert R. Natural hypometabolism during hibernation and daily torpor in mammals. Respir. Physiol. Neurobiol. 141, 317–329 (2004). - PubMed
    1. Andrews M. T. Advances in molecular biology of hibernation in mammals. Bioessays 29, 431–440 (2007). - PubMed
    1. Carey H. V., Andrews M. T. & Martin S. L. Mammalian hibernation: cellular and molecular responses to depressed metabolism and low temperature. Physiol. Rev. 83, 1153–1181 (2003). - PubMed
    1. Boutilier R. G. Mechanisms of cell survival in hypoxia and hypothermia. J. Exp. Biol. 204, 3171–3181 (2001). - PubMed

Publication types

LinkOut - more resources