

Neuroprotection Mediated through GluN2C-Containing N-methyl-D-aspartate (NMDA) Receptors Following Ischemia
- PMID: 27845401
- PMCID: PMC5109474
- DOI: 10.1038/srep37033
Neuroprotection Mediated through GluN2C-Containing N-methyl-D-aspartate (NMDA) Receptors Following Ischemia
Abstract
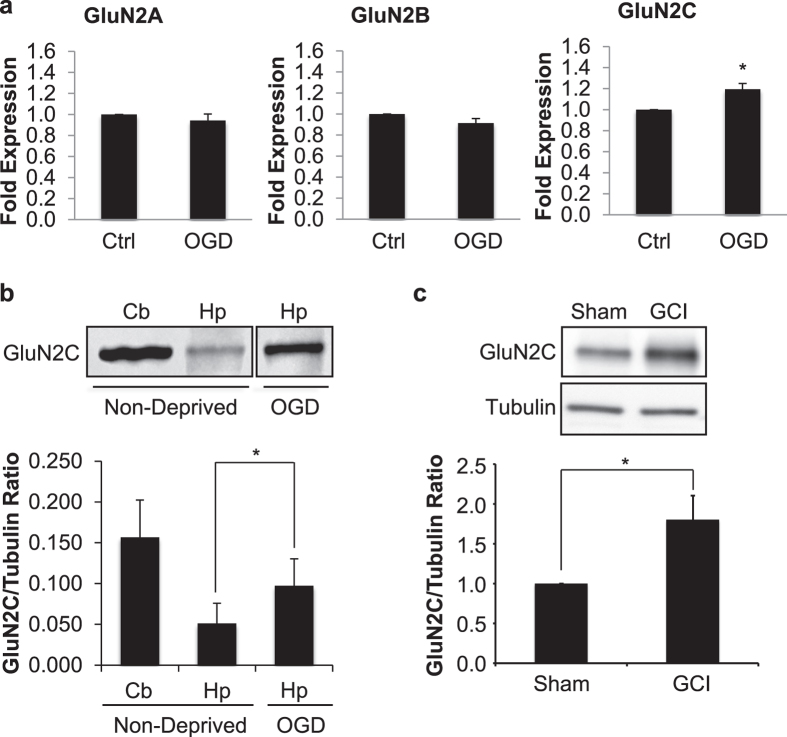
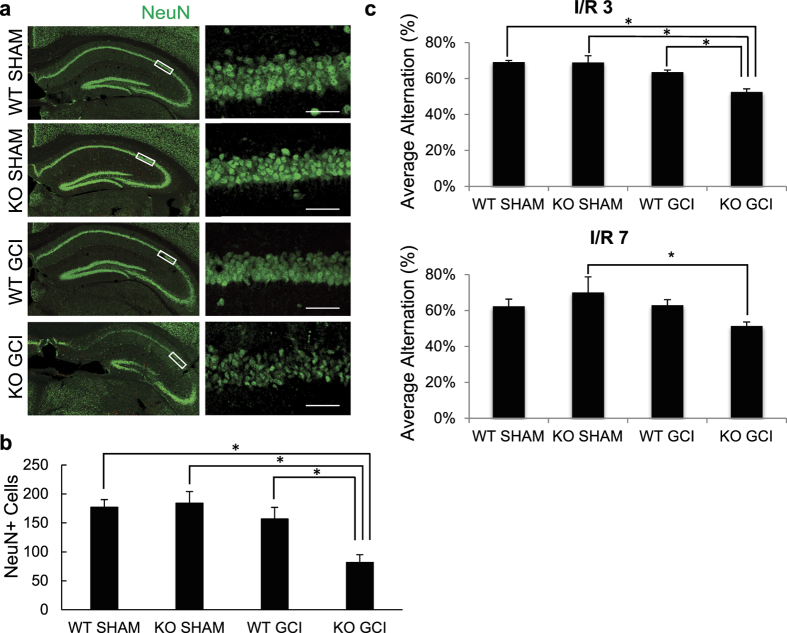
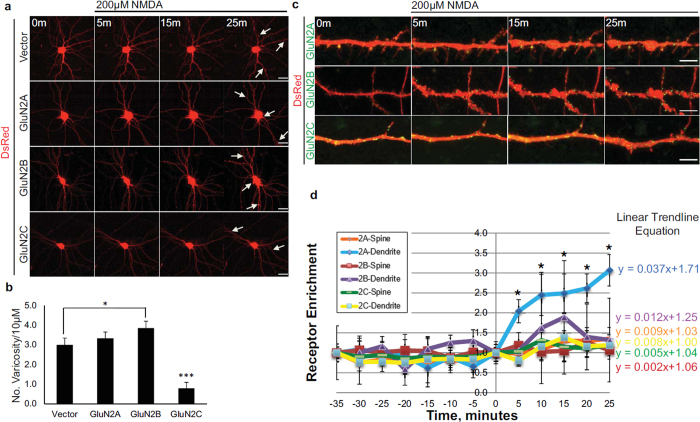
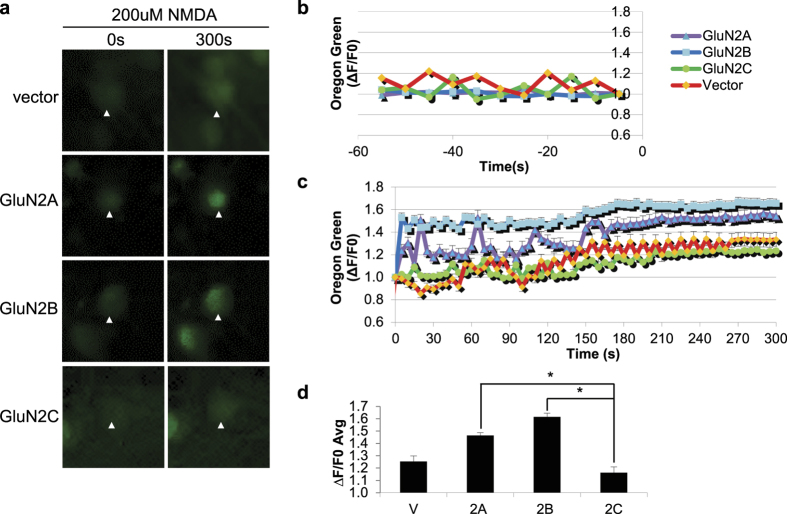
Post-ischemic activation of NMDA receptors (NMDARs) has been linked to NMDAR subunit-specific signaling that mediates pro-survival or pro-death activity. Although extensive studies have been performed to characterize the role of GluN2A and GluN2B following ischemia, there is less understanding regarding the regulation of GluN2C. Here, we show that GluN2C expression is increased in acute hippocampal slices in response to ischemia. Strikingly, GluN2C knockout mice, following global cerebral ischemia, exhibit greater neuronal death in the CA1 area of the hippocampus and reduced spatial working memory compared to wild-type mice. Moreover, we find that GluN2C-expressing hippocampal neurons show marked resistance to NMDA-induced toxicity and reduced calcium influx. Using both in vivo and in vitro experimental models of ischemia, we demonstrate a neuroprotective role of GluN2C, suggesting a mechanism by which GluN2C is upregulated to promote neuronal survival following ischemia. These results may provide insights into development of NMDAR subunit-specific therapeutic strategies to protect neurons from excitotoxicity.
Figures
Similar articles
-
Multiple domains in the C-terminus of NMDA receptor GluN2B subunit contribute to neuronal death following in vitro ischemia.Neurobiol Dis. 2016 May;89:223-34. doi: 10.1016/j.nbd.2015.11.007. Epub 2015 Nov 12. Neurobiol Dis. 2016. PMID: 26581639
-
A deficiency of the GluN2C subunit of the N-methyl-D-aspartate receptor is neuroprotective in a mouse model of ischemic stroke.Biochem Biophys Res Commun. 2018 Jan 1;495(1):136-144. doi: 10.1016/j.bbrc.2017.10.171. Epub 2017 Oct 31. Biochem Biophys Res Commun. 2018. PMID: 29101031
-
In the Telencephalon, GluN2C NMDA Receptor Subunit mRNA is Predominately Expressed in Glial Cells and GluN2D mRNA in Interneurons.Neurochem Res. 2019 Jan;44(1):61-77. doi: 10.1007/s11064-018-2526-7. Epub 2018 Apr 12. Neurochem Res. 2019. PMID: 29651654 Free PMC article.
-
Roles of GluN2C in cerebral ischemia: GluN2C expressed in different cell types plays different role in ischemic damage.J Neurosci Res. 2020 Jun;98(6):1188-1197. doi: 10.1002/jnr.24574. Epub 2019 Dec 10. J Neurosci Res. 2020. PMID: 31820502 Review.
-
The Role of GluN2A in Cerebral Ischemia: Promoting Neuron Death and Survival in the Early Stage and Thereafter.Mol Neurobiol. 2018 Feb;55(2):1208-1216. doi: 10.1007/s12035-017-0395-8. Epub 2017 Jan 19. Mol Neurobiol. 2018. PMID: 28102473 Review.
Cited by
-
Exploring NMDAR pathways in ischemic stroke: implications for neurotoxic and neuroprotective mechanisms and therapeutic strategies.Naunyn Schmiedebergs Arch Pharmacol. 2025 Jun 10. doi: 10.1007/s00210-025-04357-8. Online ahead of print. Naunyn Schmiedebergs Arch Pharmacol. 2025. PMID: 40490524 Review.
-
Excitatory Synaptic Transmission in Ischemic Stroke: A New Outlet for Classical Neuroprotective Strategies.Int J Mol Sci. 2022 Aug 19;23(16):9381. doi: 10.3390/ijms23169381. Int J Mol Sci. 2022. PMID: 36012647 Free PMC article. Review.
-
Phased Treatment Strategies for Cerebral Ischemia Based on Glutamate Receptors.Front Cell Neurosci. 2019 Apr 26;13:168. doi: 10.3389/fncel.2019.00168. eCollection 2019. Front Cell Neurosci. 2019. PMID: 31105534 Free PMC article. Review.
-
An Overview on the Differential Interplay Among Neurons-Astrocytes-Microglia in CA1 and CA3 Hippocampus in Hypoxia/Ischemia.Front Cell Neurosci. 2020 Nov 11;14:585833. doi: 10.3389/fncel.2020.585833. eCollection 2020. Front Cell Neurosci. 2020. PMID: 33262692 Free PMC article. Review.
-
Clonidine ameliorates cerebral ischemia-reperfusion injury by up-regulating the GluN3 subunits of NMDA receptor.Metab Brain Dis. 2022 Aug;37(6):1829-1841. doi: 10.1007/s11011-022-01028-y. Epub 2022 Jun 21. Metab Brain Dis. 2022. PMID: 35727521
References
-
- Wenzel A., Fritschy J. M., Mohler H. & Benke D. NMDA receptor heterogeneity during postnatal development of the rat brain: differential expression of the NR2A, NR2B, and NR2C subunit proteins. J Neurochem 68, 469–478 (1997). - PubMed
-
- Monyer H., Burnashev N., Laurie D. J., Sakmann B. & Seeburg P. H. Developmental and regional expression in the rat brain and functional properties of four NMDA receptors. Neuron 12, 529–540, doi: 0896–6273(94)90210-0 (1994). - PubMed
Publication types
MeSH terms
Substances
Grants and funding
LinkOut - more resources
Full Text Sources
Other Literature Sources
Molecular Biology Databases
Miscellaneous
