. 2016 Nov 15:7:13175.
doi: 10.1038/ncomms13175.

A time transect of exomes from a Native American population before and after European contact

Affiliations

A time transect of exomes from a Native American population before and after European contact

John Lindo et al. Nat Commun. .

Abstract

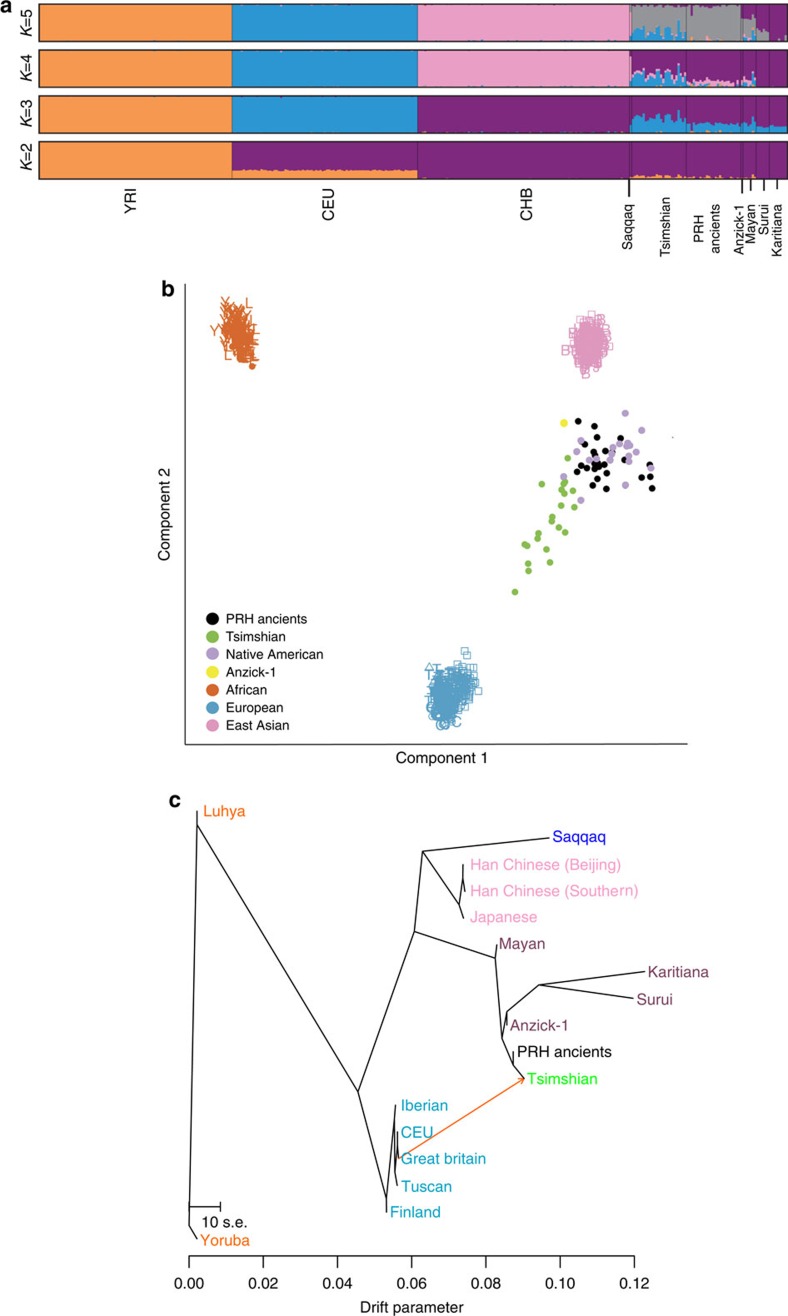
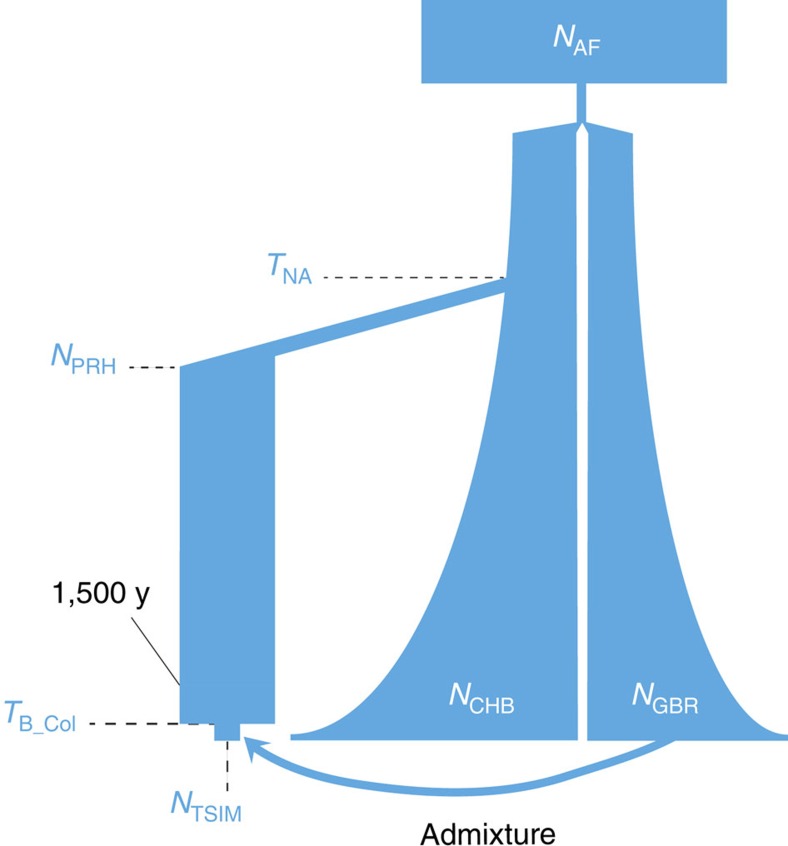
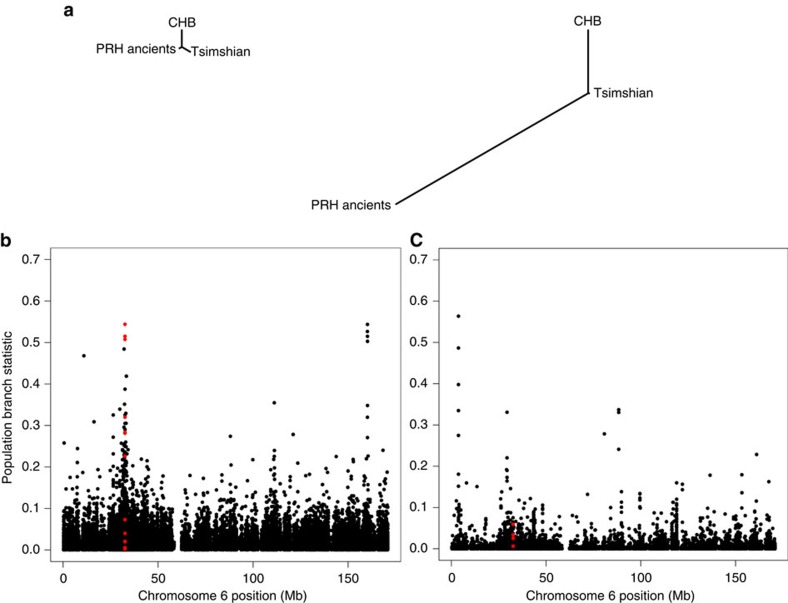
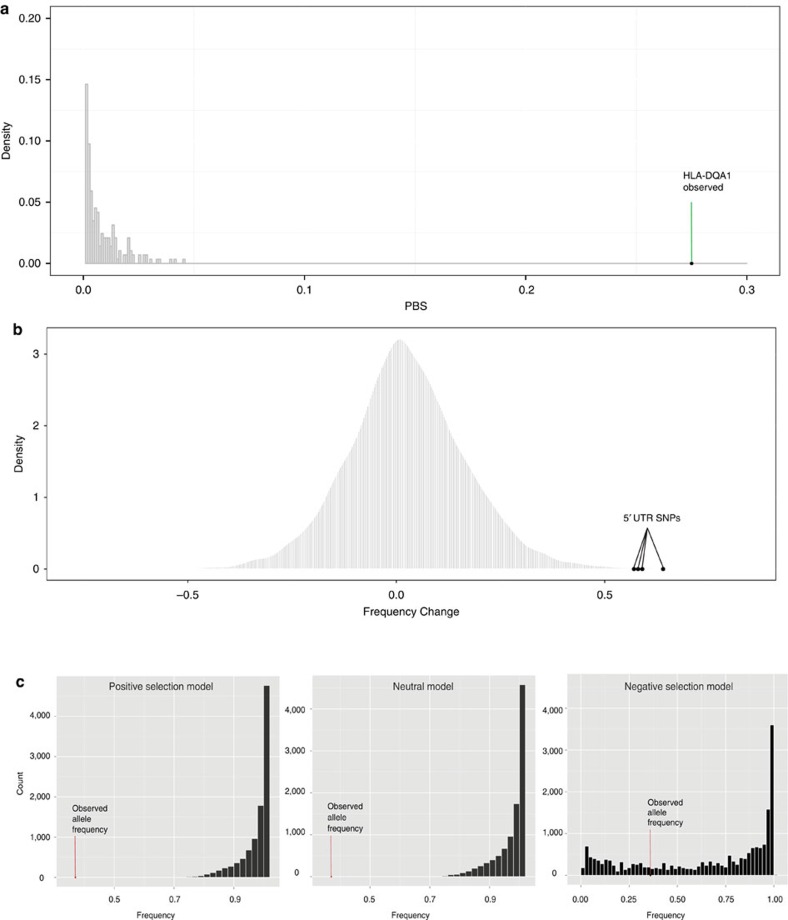
A major factor for the population decline of Native Americans after European contact has been attributed to infectious disease susceptibility. To investigate whether a pre-existing genetic component contributed to this phenomenon, here we analyse 50 exomes of a continuous population from the Northwest Coast of North America, dating from before and after European contact. We model the population collapse after European contact, inferring a 57% reduction in effective population size. We also identify signatures of positive selection on immune-related genes in the ancient but not the modern group, with the strongest signal deriving from the human leucocyte antigen (HLA) gene HLA-DQA1. The modern individuals show a marked frequency decrease in the same alleles, likely due to the environmental change associated with European colonization, whereby negative selection may have acted on the same gene after contact. The evident shift in selection pressures correlates to the regional European-borne epidemics of the 1800s.


Figures

Figure 1
Figure 1. Population structure and demographic model of the PRH Ancients and Tsimshian.
(a) ADMIXTURE analysis depicting ancestry proportions assuming the number of genetic components, K, is 2–5. The analyses included reference populations from the 1,000 Genomes Project Phase 2 data set, Native American individuals sampled from the Karitiana, Surui and Maya, and two ancient samples from the Americas—the Saqqaq and Anzick-1 (ref. 23). (b) Multidimensional scaling plot. The Native American (Surui, Mayan and Karitiana) populations fall with the PRH Ancients and the Anzick-1 ancient sample from Montana. The modern Tsimshian fall along the gradient leading from the Native Americans and the Europeans, reflecting their admixed history with Europeans. (c) TreeMix graph with a single admixture event.
Figure 2
Figure 2. Demographic model.
Best-fitting model depicting the Tsimshian bottleneck after European contact and the subsequent admixture with Europeans. Fixed demographic parameters are from Gravel et al. and admixture parameters are from Verdu et al.. The parameters in blue were inferred with FastSimCoal2 (ref. 54). Population sizes and time splits are not shown to scale. The model's labels are defined as: NAF,African effective population size (Ne); NCHB, CHB Ne; NGBR, GBR Ne; NPRH,PRH Ancients Ne; NTsim, Tsimshian Ne; TNA, time of split between PRH Ancients and CHB; TB_Col, time of colonial contact bottleneck.
Figure 3
Figure 3. Population branch statistic (PBS) of the HLA-DQA1 gene.
(a) Trees based on exome-wide data, with the left tree showing a small branch length of the PRH Ancients relative to Tsimshian and CHB and the right tree showing strong differentiation along the PRH Ancients branch at the HLA-DQA1 gene. (b,c) Manhattan plots of the PBS score calculated on a per-SNP basis as a function of SNP position on chromosome 6 for the PRH Ancients (b) and the modern Tsimshian (c). The region highlighted in red shows PBS scores for SNPs within 10 kb of the HLA-DQA1 gene.
Figure 4
Figure 4. Selection scenarios before and after European Contact.
(a) Distribution of PBS scores for long-term balancing selection (heterozygote advantage) simulations involving a genomic region of the same length as the HLA-DQA1 transcript. Given the observed PBS score in the ancient population, this form of balancing selection is inconsistent with our data. (b) Empirical distribution of frequency changes for all derived alleles in the exome between the ancient and modern populations, showing the HLA-DQA1 UTR5 SNPs as outliers. (c) Simulations of different selection schemes and the allele frequency of the HLA-DQA1 SNPs observed in the modern Tsimshian. The allele frequency changes between the ancient and modern populations could not be explained by our demographic model (shift due to neutrality after European contact) or one that included only positive selection (no shift from positive selection after European contact). None of the simulations in which the originally positively-selected allele is neutral or still under positive selection after the time of European contact reached the observed allele frequency in the modern population. A model that incorporated negative selection after European contact was a better fit to our data, where ∼26% of the simulations reached the observed frequency.

References

    1. Thornton R. Aboriginal North American Population and Rates of Decline, ca. a.d. 1500-1901. Curr. Anthropol. 38, 310–315 (1997).
    1. Thornton R. American Indian Holocaust and Survival University of Oklahoma Press (1987).
    1. Patterson K. B. & Runge T. Smallpox and the Native American. Am. J. Med. Sci. 323, 216 (2002). - PubMed
    1. Boyd R. T. The Coming of the Spirit of Pestilence University of Washington Press (1999).
    1. Dobyns H. F. Disease transfer at contact. Annu. Rev. Anthropol. 22, 273–291 (1993).

Publication types