. 2016 Nov 15;12(11):e1006425.
doi: 10.1371/journal.pgen.1006425. eCollection 2016 Nov.

Pleiotropic Mechanisms Indicated for Sex Differences in Autism

Affiliations

Pleiotropic Mechanisms Indicated for Sex Differences in Autism

Ileena Mitra et al. PLoS Genet. .

Erratum in

  • Correction: Pleiotropic Mechanisms Indicated for Sex Differences in Autism.
    Mitra I, Tsang K, Ladd-Acosta C, Croen LA, Aldinger KA, Hendren RL, Traglia M, Lavillaureix A, Zaitlen N, Oldham MC, Levitt P, Nelson S, Amaral DG, Hertz-Picciotto I, Fallin MD, Weiss LA. Mitra I, et al. PLoS Genet. 2017 Jun 7;13(6):e1006831. doi: 10.1371/journal.pgen.1006831. eCollection 2017 Jun. PLoS Genet. 2017. PMID: 28591140 Free PMC article.

Abstract

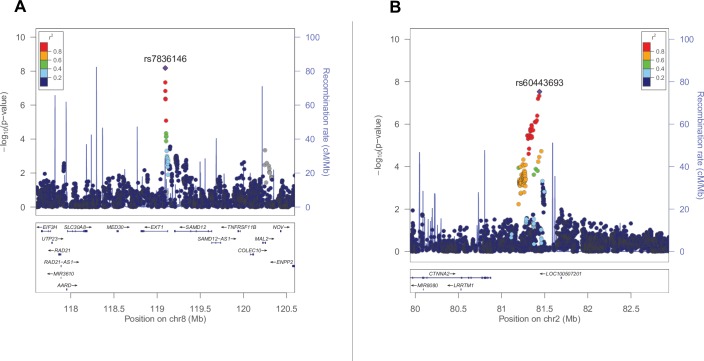
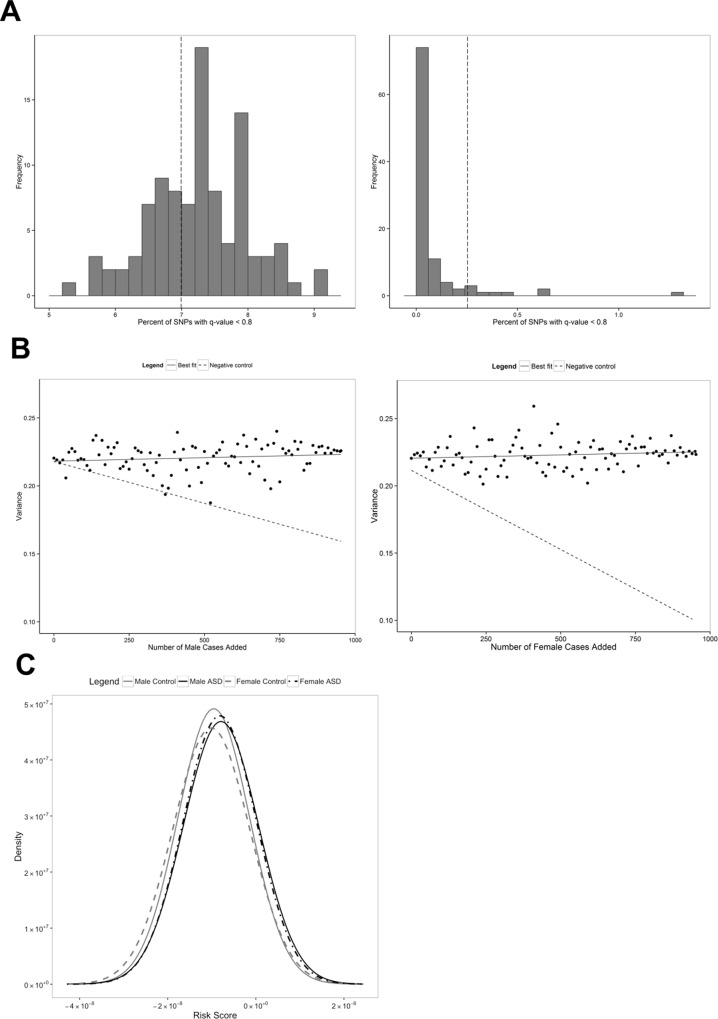
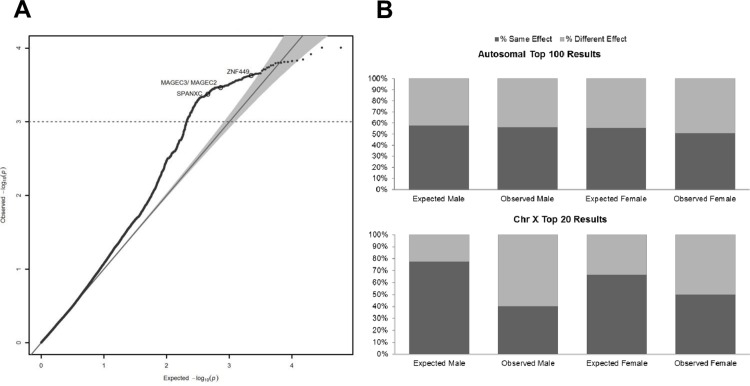
Sexual dimorphism in common disease is pervasive, including a dramatic male preponderance in autism spectrum disorders (ASDs). Potential genetic explanations include a liability threshold model requiring increased polymorphism risk in females, sex-limited X-chromosome contribution, gene-environment interaction driven by differences in hormonal milieu, risk influenced by genes sex-differentially expressed in early brain development, or contribution from general mechanisms of sexual dimorphism shared with secondary sex characteristics. Utilizing a large single nucleotide polymorphism (SNP) dataset, we identify distinct sex-specific genome-wide significant loci. We investigate genetic hypotheses and find no evidence for increased genetic risk load in females, but evidence for sex heterogeneity on the X chromosome, and contribution of sex-heterogeneous SNPs for anthropometric traits to ASD risk. Thus, our results support pleiotropy between secondary sex characteristic determination and ASDs, providing a biological basis for sex differences in ASDs and implicating non brain-limited mechanisms.


Conflict of interest statement

The authors have declared that no competing interests exist.

Figures

Fig 1
Fig 1. Plot of region surrounding most significant SNPs.
(A) Male ASD association results surrounding rs7836146 in the region chromosome 8: 117.6–120.5 Mbp. (B) Female ASD association results surrounding rs60443693 in the region chromosome 2: 79.9–82.9 Mbp. Plots were generated using LocusZoom[88] (see URLs). SNP position information based on hg19 reference version and LD and recombination rate data based on 1000 Genomes (November 2014) EUR population. SNPs are colored based on linkage disequilibrium (LD) correlation (r2), or colored gray if no LD information exists. The overlaid blue line corresponds to the recombination rate.
Fig 2
Fig 2. Increased female genetic risk load.
(A) Autosomal genetic load. The distributions of sex-permuted autosomal signal enrichment at an FDR q-value threshold of 0.8 are compared to the male-specific and female-specific percent of SNPs with q-value < 0.8 (dashed line indicates males = 6.99%, females = 0.25%). (B) Correlation between the number of male or female cases added and heritability estimate. The solid line displayed is the linear best fit line. The dashed line is the linear best fit line for the correlation between the number of male or female pseudo-controls added and heritability estimate (negative control). (C) Predicted risk scores. Comparison of probability densities of predicted risk scores for males and females with and without ASDs. The order of the distributions from lowest to highest mean risk score (left to right) is: female controls (dashed gray line), male controls (solid gray line), female ASD cases (dashed black line), and male ASD cases (solid black line).
Fig 3
Fig 3. Sex heterogeneity on the X chromosome.
(A) Quantile-quantile (QQ) plot of Cochran’s Q results. The QQ plot displays the heterogeneity estimates for SNPs on chromosome X between male-specific and female-specific association results. SNPs with Cochran’s P < 10−3 and a greater absolute effect size in males are circled. (B) Binomial sign test results. The minor allele direction is compared for the most significant independent SNPs in male-specific or female-specific association results to the opposite sex. 100 autosomal SNPs and 20 chromosome X SNPs were used for comparison. The expected value for each set is based on the mean percent in the same direction from the sex-permuted association results.

References

    1. Prevalence of autism spectrum disorder among children aged 8 years—autism and developmental disabilities monitoring network, 11 sites, United States, 2010. MMWR Surveill Summ. 2014;63: 1–21. - PubMed
    1. Frazier TW, Thompson L, Youngstrom EA, Law P, Hardan AY, Eng C, et al. A twin study of heritable and shared environmental contributions to autism. J Autism Dev Disord. 2014;44: 2013–2025. 10.1007/s10803-014-2081-2 - DOI - PMC - PubMed
    1. Hallmayer J, Cleveland S, Torres A, Phillips J, Cohen B, Torigoe T, et al. Genetic heritability and shared environmental factors among twin pairs with autism. Arch Gen Psychiatry. 2011;68: 1095–102. 10.1001/archgenpsychiatry.2011.76 - DOI - PMC - PubMed
    1. Robinson EB, Koenen KC, McCormick MC, Munir K, Hallett V, Happé F, et al. Evidence that autistic traits show the same etiology in the general population and at the quantitative extremes (5%, 2.5%, and 1%). Arch Gen Psychiatry. 2011;68: 1113–21. 10.1001/archgenpsychiatry.2011.119 - DOI - PMC - PubMed
    1. Gaugler T, Klei L, Sanders SJ, Bodea CA, Goldberg AP, Lee AB, et al. Most genetic risk for autism resides with common variation. Nat Genet. 2014;46: 881–5. 10.1038/ng.3039 - DOI - PMC - PubMed

MeSH terms