MicroRNA Expression for Early Prediction of Late Occurring Hematologic Acute Radiation Syndrome in Baboons
- PMID: 27846229
- PMCID: PMC5113049
- DOI: 10.1371/journal.pone.0165307
MicroRNA Expression for Early Prediction of Late Occurring Hematologic Acute Radiation Syndrome in Baboons
Abstract
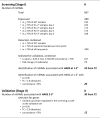
For effective medical management of radiation-exposed persons after a radiological/nuclear event, blood-based screening measures in the first few days that could predict hematologic acute radiation syndrome (HARS) are needed. For HARS severity prediction, we used microRNA (miRNA) expression changes measured on days one and two after irradiation in a baboon model. Eighteen baboons underwent different patterns of partial or total body irradiation, corresponding to an equivalent dose of 2.5 or 5 Gy. According to changes in blood cell counts (BCC) the surviving baboons (n = 17) exhibited mild (H1-2, n = 4) or more severe (H2-3, n = 13) HARS. In a two Stage study design we screened 667 miRNAs using a quantitative real-time polymerase chain reaction (qRT-PCR) platform. In Stage II we validated candidates where miRNAs had to show a similar regulation (up- or down-regulated) and a significant 2-fold miRNA expression difference over H0. Seventy-two candidate miRNAs (42 for H1-2 and 30 for H2-3) were forwarded for validation. Forty-two of the H1-2 miRNA candidates from the screening phase entered the validation step and 20 of them showed a statistically significant 2-4 fold up-regulation relative to the unexposed reference (H0). Fifteen of the 30 H2-3 miRNAs were validated in Stage II. All miRNAs appeared 2-3 fold down-regulated over H0 and allowed an almost complete separation of HARS categories; the strongest candidate, miR-342-3p, showed a sustained and 10-fold down-regulation on both days 1 and 2. In summary, our data support the medical decision making of the HARS even within the first two days after exposure where diagnostic tools for early medical decision are required but so far missing. The miRNA species identified and in particular miR-342-3p add to the previously identified mRNAs and complete the portfolio of identified mRNA and miRNA transcripts for HARS prediction and medical management.
Conflict of interest statement
The authors have declared that no competing interests exist.
Figures


Similar articles
-
First Generation Gene Expression Signature for Early Prediction of Late Occurring Hematological Acute Radiation Syndrome in Baboons.Radiat Res. 2016 Jul;186(1):39-54. doi: 10.1667/RR14318.1. Epub 2016 Jun 22. Radiat Res. 2016. PMID: 27333084
-
Gene expression signature for early prediction of late occurring pancytopenia in irradiated baboons.Ann Hematol. 2017 May;96(5):859-870. doi: 10.1007/s00277-017-2952-7. Epub 2017 Feb 24. Ann Hematol. 2017. PMID: 28236054 Free PMC article.
-
Pre-Exposure Gene Expression in Baboons with and without Pancytopenia after Radiation Exposure.Int J Mol Sci. 2017 Mar 2;18(3):541. doi: 10.3390/ijms18030541. Int J Mol Sci. 2017. PMID: 28257102 Free PMC article.
-
Rapid High-Throughput Diagnostic Triage after a Mass Radiation Exposure Event Using Early Gene Expression Changes.Radiat Res. 2019 Aug;192(2):208-218. doi: 10.1667/RR15360.1. Epub 2019 Jun 18. Radiat Res. 2019. PMID: 31211643
-
Early molecular markers for retrospective biodosimetry and prediction of acute health effects.J Radiol Prot. 2022 Jan 25;42(1). doi: 10.1088/1361-6498/ac2434. J Radiol Prot. 2022. PMID: 34492641 Review.
Cited by
-
Transcriptomics for radiation biodosimetry: progress and challenges.Int J Radiat Biol. 2023;99(6):925-933. doi: 10.1080/09553002.2021.1928784. Epub 2021 May 21. Int J Radiat Biol. 2023. PMID: 33970766 Free PMC article. Review.
-
MicroRNAs: Novel clinical biomarkers for cancer radiotherapy (Review).Mol Med Rep. 2025 Sep;32(3):254. doi: 10.3892/mmr.2025.13619. Epub 2025 Jul 11. Mol Med Rep. 2025. PMID: 40641137 Free PMC article. Review.
-
A Review of Radiation-Induced Alterations of Multi-Omic Profiles, Radiation Injury Biomarkers, and Countermeasures.Radiat Res. 2023 Jan 1;199(1):89-111. doi: 10.1667/RADE-21-00187.1. Radiat Res. 2023. PMID: 36368026 Free PMC article. Review.
-
MicroRNA: a novel implication for damage and protection against ionizing radiation.Environ Sci Pollut Res Int. 2021 Apr;28(13):15584-15596. doi: 10.1007/s11356-021-12509-5. Epub 2021 Feb 3. Environ Sci Pollut Res Int. 2021. PMID: 33533004 Free PMC article. Review.
-
Ionizing radiation-induced altered microRNA expression as biomarkers for assessing acute radiation injury.Expert Rev Mol Diagn. 2017 Oct;17(10):871-874. doi: 10.1080/14737159.2017.1366316. Epub 2017 Aug 14. Expert Rev Mol Diagn. 2017. PMID: 28792262 Free PMC article. Review. No abstract available.
References
-
- Iaea. Cytogenetic Analysis for Radiation Dose Assessment—A Manual. Tech Rep Ser …. 2001; 138. Available: http://www.teneb.eu/IAEA_report_405.pdf
MeSH terms
Substances
LinkOut - more resources
Full Text Sources
Other Literature Sources

